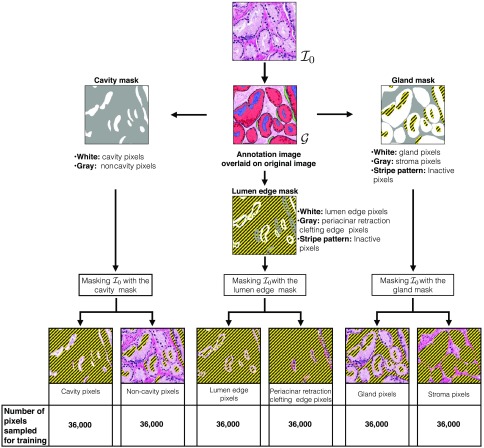
Fig. 2.
Gland and stroma regions are extracted from image to the gland mask (right). Cavity and noncavity regions are extracted from image to the cavity mask (left). Lumen edge and periacinar retraction clefting edge regions are extracted from image to the lumen edge mask (bottom). We also separate the binary groupings in the three masks to show each grouping separately in six images at the bottom. In all of these images, the inactive pixels are shown in a stripe pattern. Active pixels are shown using the RGB values of the original image. In the six pixel grouping images, only the active pixels are used for sampling a particular group (type) of pixels. We also indicate the total number of pixels sampled from each grouping for training of pixel classifiers.

