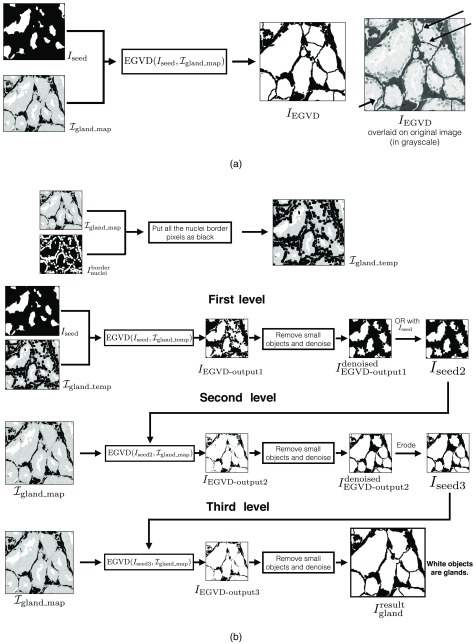
Fig. 7.
(a) Example of EGVD output with and as inputs. Top-right black arrows indicate gland boundaries being predicted within the cytoplasm. Bottom-left black arrow indicates one of the glands that was grown from extraneous seed. (b) Complete workflow for the THREE-LEVEL-EGVD algorithm (Algorithm 5).

