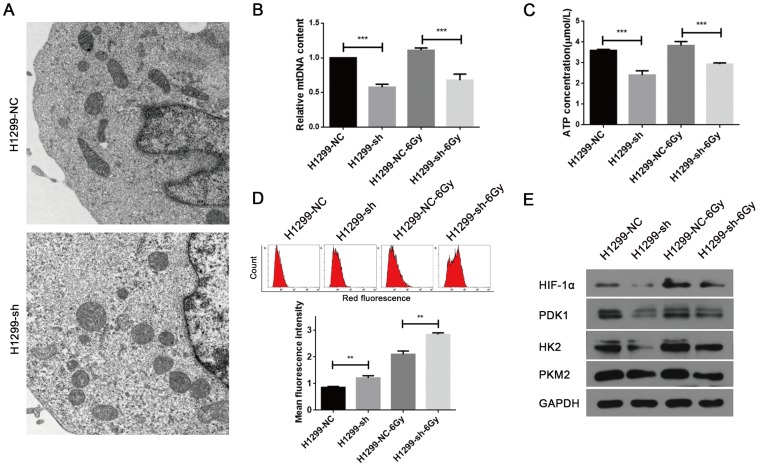
Figure 3.
SSBP1 knockdown induced mitochondrial dysfunction of H1299 cells. (a) Mitochondrial morphology was observed with transmission electron microscopy in H1299-NC and H1299-sh cells (magnification, ×5,000). (b) Real-time PCR was determined to analyze the mtDNA copy number in H1299-NC and H1299-sh groups, without radiation or 30 min after 6Gy. (c) Intracellular ATP concentrations in the H1299-NC and H1299-sh cells were measured by the ATP Assay Kit, without radiation or 30 min after 6Gy. (d) Mitochondrial ROS (mROS) production levels were measured by MitoSOX Red fluorescence intensity, without radiation or 30 min after 6Gy. (upper image: mROS measured by flow cytometry; lower chart: mROS levels were depictured as a bar chart) (e) The effects of SSBP1 knockdown on the expressions of HIF-1α, PDK1, HK2, PKM2, without radiation or 24 h after 6Gy. **P<0.01, ***P<0.001.

