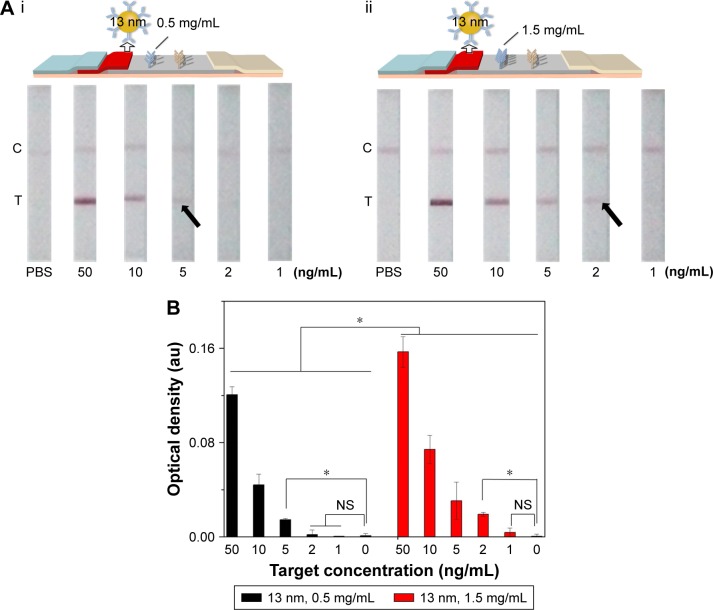
Figure 3.
The effect of antibody concentration at the test line on LFIA performance.
Notes: (A) The schematic diagram and results of the LFIA with 0.5 mg/mL (i) and 1.5 mg/mL coating antibody (ii). (B) Optical density analysis of (A) (n=3, *P<0.05). (The arrows reference the detection limit of the results).
Abbreviations: LFIA, lateral flow immunoassay; NS, no significance; PBS, phosphate-buffered saline; C, control line; T, test line.

