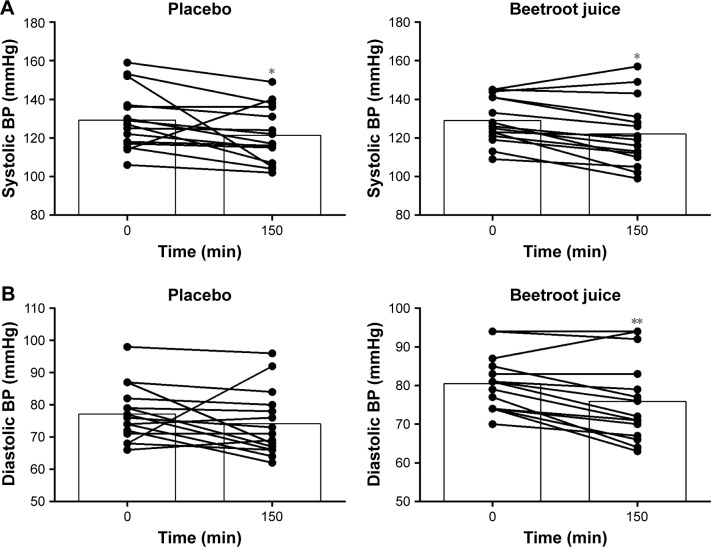
Figure 6.
Individual and mean response in (A) systolic blood pressure (mmHg) and (B) diastolic blood pressure (mmHg) (n=15).
Notes: *P<0.01 denotes difference between baseline and 150 min after ingestion of both placebo and BR. **P<0.05 denotes difference between baseline and 150 min after ingestion of BR.
Abbreviations: BP, blood pressure; BR, beetroot juice.

