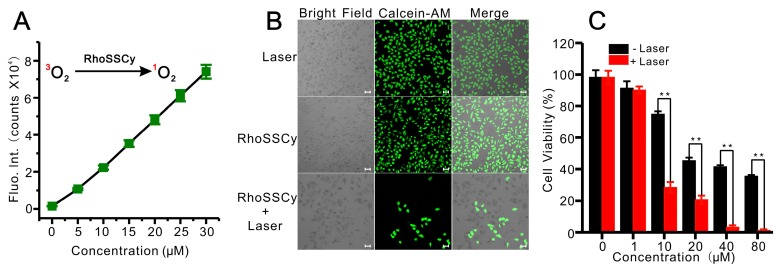
Figure 7.
Photodynamic therapy using RhoSSCy in vitro. (A) The linear relationship between fluorescent intensity of DCF, which correlated to the release of ROS, and RhoSSCy concentration. (B) Fluorescent images of MCF-7 cells under the different conditions. Viable cells were stained green with calcein-AM. Bars, 25 μm. (C) Cell survivals of MCF-7 after PDT treatment using RhoSSCy with different concentration.

