Figure 2.
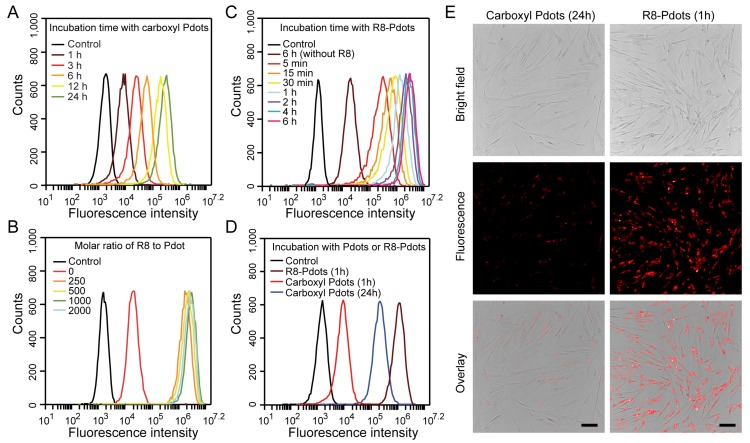
Labeling brightness of MSCs by NIR775-doped Pdots analyzed by flow cytometry and fluorescent imaging. A) Flow cytometry of MSCs incubated with carboxyl Pdots at 30 μg/mL for different incubation time. B) Flow cytometry of MSCs incubated with R8-Pdots at different R8/Pdot molar ratio for 4 hours. C) Flow cytometry of MSCs incubated with R8-Pdots at R8/Pdot molar ratio of 1000 for different time. D) Brightness comparisons of MSCs labeled with carboxyl Pdots and R8-Pdots. E) Fluorescence imaging of MSCs labeled with carboxyl Pdots and R8-Pdots, respectively. Scale bar represents 100 μm.

