Figure 3.
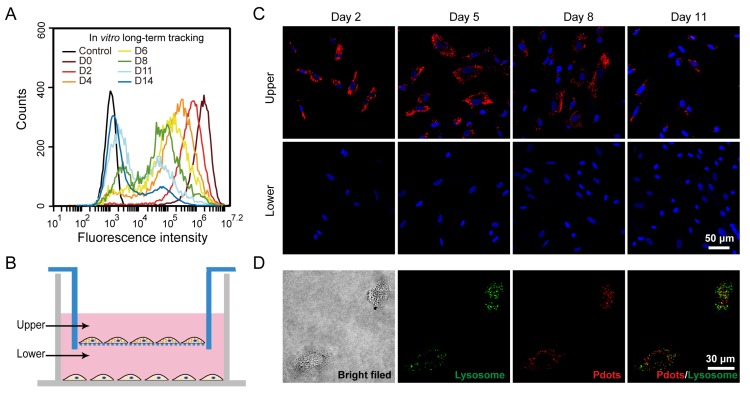
A) Long-term in vitro tracking performance of MSCs labeled by R8-Pdots at 10 μg/mL for 4-hour incubation. The fluorescence intensity was analyzed by flow cytometry as the labeled MSCs were cultured for designated time intervals. The unlabeled MSCs were used as the control. B) Schematic illustration of the transwell migration system for examining the cell exocytosis of Pdots. The Pdot-labeled and unlabeled MSCs were separately cultured in upper and lower chamber, isolated by porous membrane (pore size 0.4 μm). C) Confocal fluorescence images of the Pdot-labeled MSCs in the upper chamber and the unlabeled MSCs in the lower chamber in 2, 5, 8 and 11 days post labeling. D) Confocal fluorescence images of lysosome staining of the Pdot-labeled MSCs.

