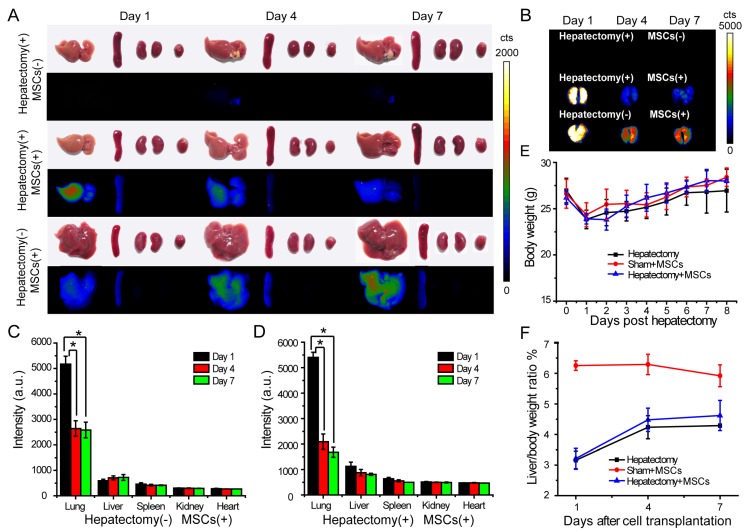
Figure 5.
In vivo tracking of MSCs in a liver-resection mouse model. The Pdot-labeled MSCs were intravenously transplanted into the mice with liver-resection surgery. The organs were collected from the mice at designated times, and imaged by a biophotonic imaging system. The images in A and B showed fluorescence signals from the organs under the same excitation and collection conditions. A) Distribution of MSCs in liver, spleen, kidney and heart. B) Distribution of MSCs in lung. C) Quantitative fluorescence analysis of the Pdot-labeled MSCs in liver, lung, spleen, kidney and heart in day 1, day 4, day 7 post cell transplantation into mice from sham group. D) Quantitative fluorescence analysis of the Pdot-labeled MSCs in liver, lung, spleen, kidney and heart in day 1, day 4, day 7 post cell transplantation into mice from cell therapy group. E) Change of the body weight of the mice post hepatectomy. F) Change of the liver to body weight ratio (%) of the mice in day 1, day 4, day 7 post cell transplantation.

