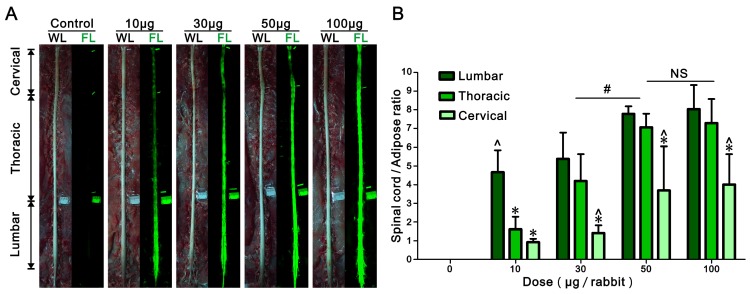
Figure 3.
Dose response of BMB imaging of spinal cord at 30 min post-injection. (A) Observation of the spinal cord under white or UV light after epidural administration of BMB-m solution at different BMB doses (from 10 to 100 μg/rabbit). The complete imaging of spinal cord can be realized even at the dose as low as 10 μg/rabbit. (B) The fluorescence ratios of spinal cord to adipose (SC/A) at lumbar, thoracic and cervical spinal cord segments at different doses. The SC/A ratios of 50 μg/rabbit dose group are significantly higher than those of 10 μg/rabbit and 30 μg/rabbit dose groups (#P < 0.05), while it show no remarkable difference with 100 μg/rabbit dose group. In the dose group of 10 μg/rabbit, the SC/A ratio of lumbar segment is significantly higher than those of thoracic and cervical segments (*P < 0.05). In the dose groups from 30 to 100 μg/rabbit, the SC/A ratios of lumbar and thoracic segments are significantly higher than that of cervical segment (^P < 0.05). Data shown represent mean ± SD of at least three experiments; #P < 0.05 versus 50 μg/rabbit dose group (two-way ANOVA with Bonferroni post-tests); *P < 0.05 versus lumbar in same group (two-way ANOVA with Bonferroni post-tests); ^P < 0.05 versus thoracic in same group (two-way ANOVA with Bonferroni post-tests); NS, not significant (two-way ANOVA with Bonferroni post-tests). WL: white light; FL: fluorescence.

