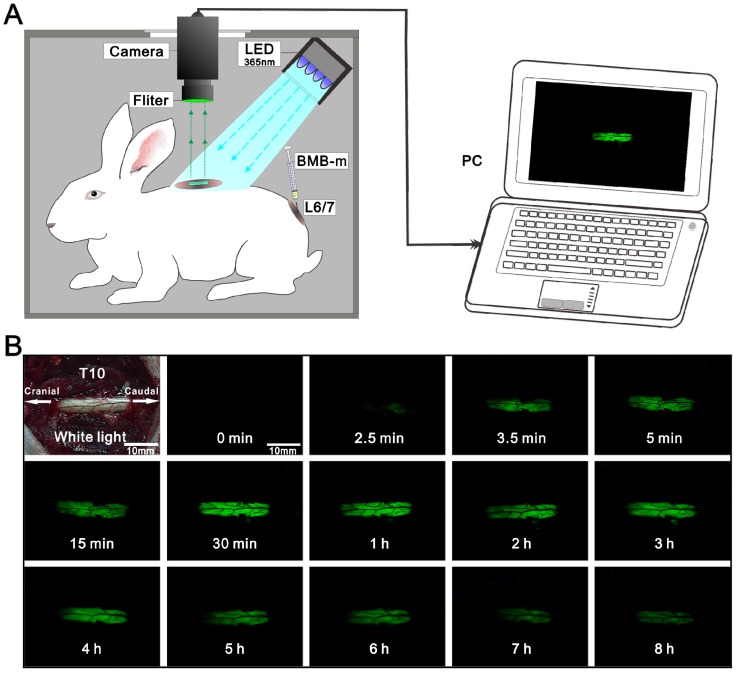
Figure 4.
Dynamic viewing of the fluorescence at the T10 spinal cord in the rabbit (See Video S1). (A) Schematic illustration of real-time and in-situ monitoring of the fluorescence at the T10 spinal cord after a single-dose of epidural BMB (50 µg, in BMB-m formulation) at L6/7. (B) The represent fluorescence images of the T10 spinal cord at different time points.

