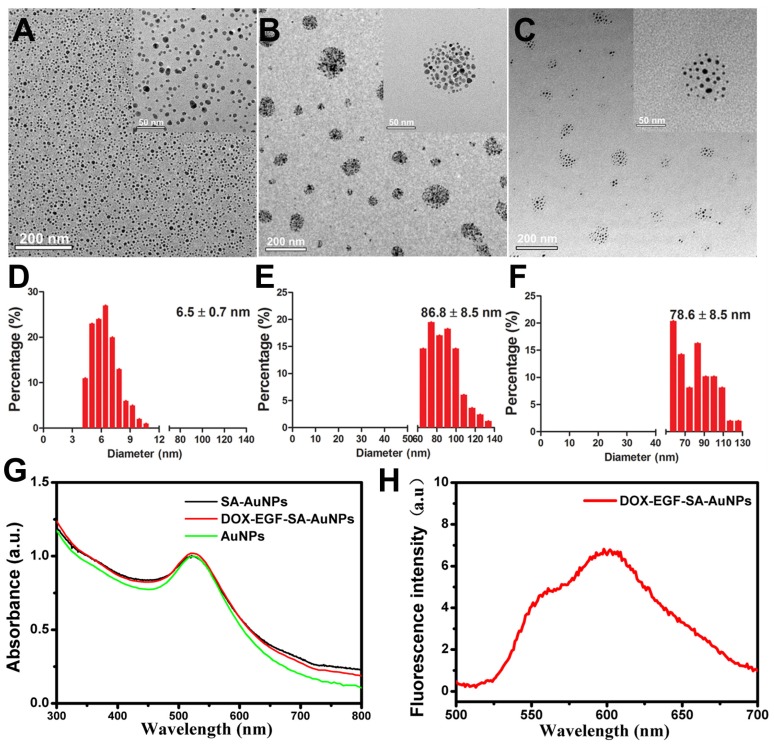
Figure 1.
Characterization of self-assembled AuNPs. (A-C) Representative TEM images of AuNPs, SA-AuNPs and DOX-EGF-SA-AuNPs, respectively. (D-F) Histograms of the particle size distribution through 100 particles statistics from TEM images by measuring the diameter of the particles. (G) UV-Vis spectra of AuNPs (black line), SA-AuNPs (red line) and DOX-EGF-SA-AuNPs (green line). (f) Fluorescence spectrum of DOX-EGF-SA-AuNPs solution under 488 nm excitation.

