
Fig. 6.
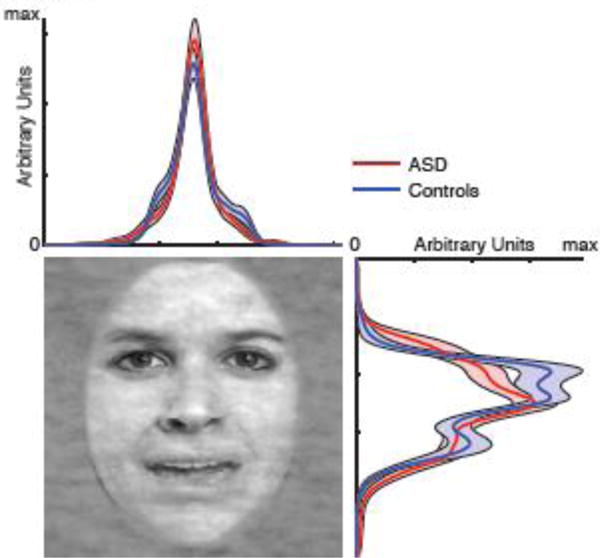
Spatial distribution of fixations along each dimension of the face. Each curve is the probability density function of fixating a given location within a 1s period after face onset. Shaded area denotes ±SEM across participants.
Official websites use .gov
A
.gov website belongs to an official
government organization in the United States.
Secure .gov websites use HTTPS
A lock (
) or https:// means you've safely
connected to the .gov website. Share sensitive
information only on official, secure websites.
Spatial distribution of fixations along each dimension of the face. Each curve is the probability density function of fixating a given location within a 1s period after face onset. Shaded area denotes ±SEM across participants.