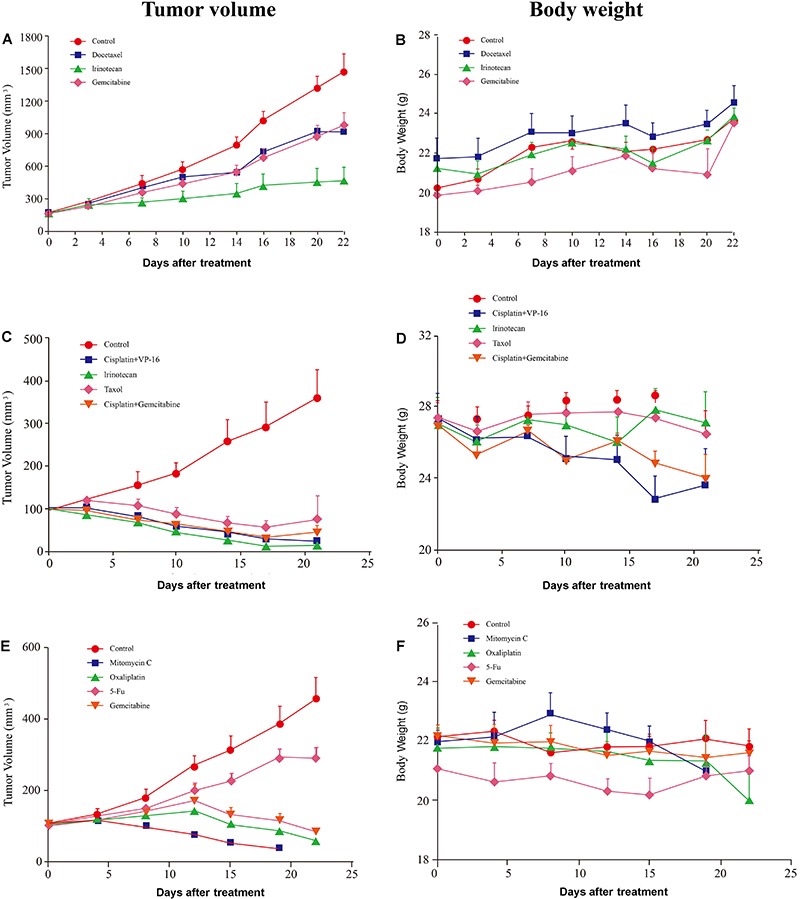
Figure 4. P2 tumor volume/time growth curves and mice body weight/time curves after the administration of chemotherapeutic drugs of patient-derived tumor xenograft (PDTX) small cell carcinoma (010000) (A and B), lung cancer (010026) (C and D) and adenocarcinoma (010027) (E and F).

