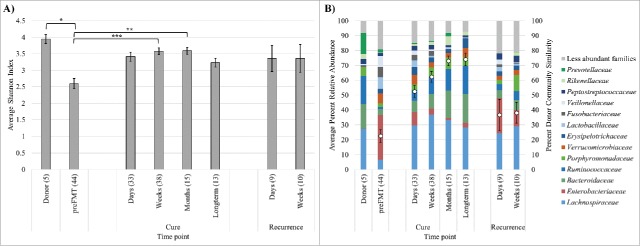
Figure 1.
Shannon indices (A) and distributions of abundant families (B) among sample groups. Families shown are those present at mean >2.0 % among all samples, and bars indicate averages of family abundances for each sample group. The percent donor similarity, determined by SourceTracker, is shown within the stacked column (mean ± standard error). Significance *P < 0.05, **P < 0.01, *** P < 0.0001 by Tukey's post-hoc test. Numbers in parentheses indicate numbers of samples averaged.

