
Figure 3.
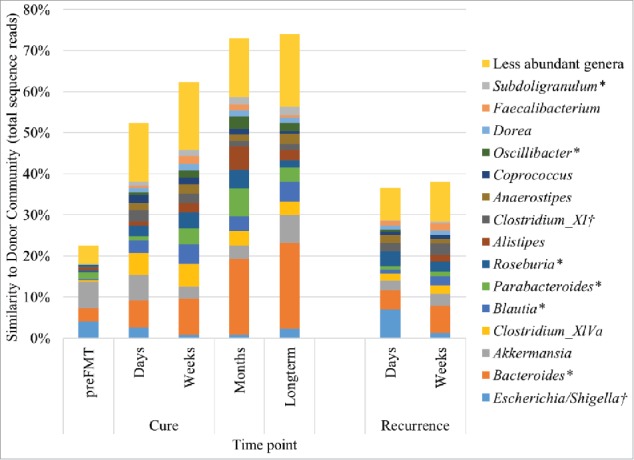
Distribution of genera associated with donor engraftment by SourceTracker, determined as percent similarity to donor communities. The abundances of several genera were also determined to be significantly positively (*) or negatively (†) correlated with time (days) post-FMT among cured patient samples and those collected ≥ 1 month post-FMT (Table 1).