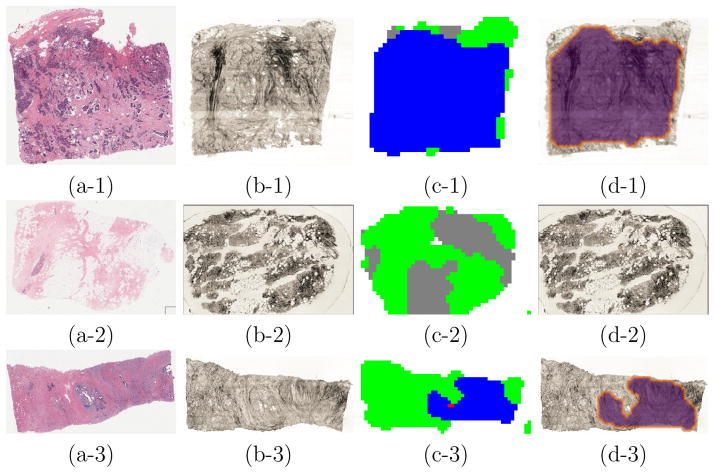
Figure 12.
Breast tissue OCM image classification results. The results include two classes of images: image of tissue with tumor (image 1 and 3), and image of tissue without tumor (image 2). (a) histology image; (b) OCM image; (c) classification result; (d) probability distribution (i.e. heat map) of tumor tissue.

