
Figure 19.
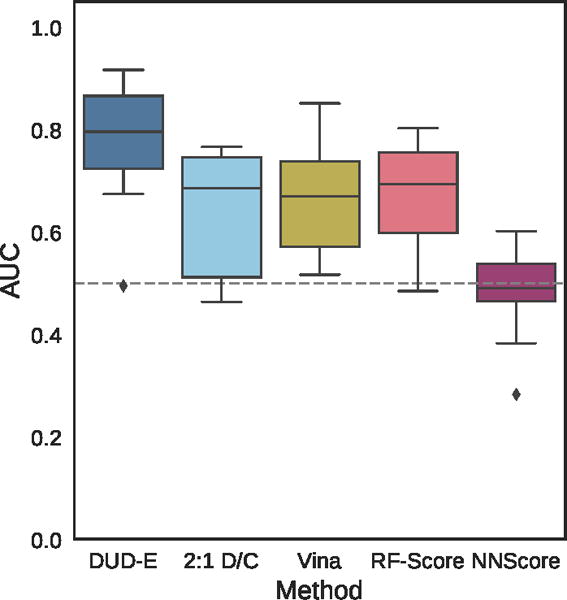
Distribution of the area under the ROC curve for targets of the ChEMBL dataset for the pose-insensitive CNN model trained only on DUD-E, the pose-sensitive DUD-E/CSAR 2:1 model, Vina, RF-Score, and NNScore.
Official websites use .gov
A
.gov website belongs to an official
government organization in the United States.
Secure .gov websites use HTTPS
A lock (
) or https:// means you've safely
connected to the .gov website. Share sensitive
information only on official, secure websites.
Distribution of the area under the ROC curve for targets of the ChEMBL dataset for the pose-insensitive CNN model trained only on DUD-E, the pose-sensitive DUD-E/CSAR 2:1 model, Vina, RF-Score, and NNScore.