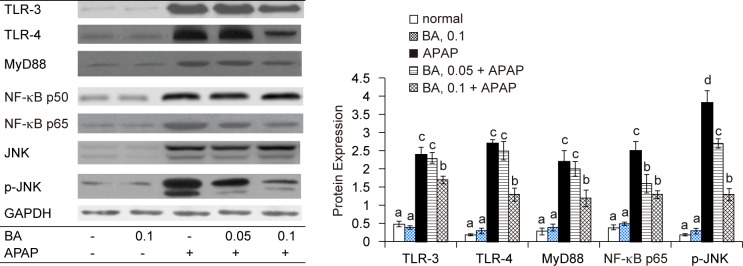
Fig. 5.
Hepatic protein expression of TLR-3, TLR-4, MyD88, NF-κB p50, NF-κB p65, JNK and p-JNK in mice with BA intake at 0, 0.05 or 0.1% for 4 weeks, and followed by APAP treatment. Normal groups had neither BA nor APAP treatment. BA groups had 0.1% BA intake without APAP treatment. A representative image is shown for each group. Values are mean ± SD, n = 10. a-dMeans among bars without a common letter differ, P < 0.05.

