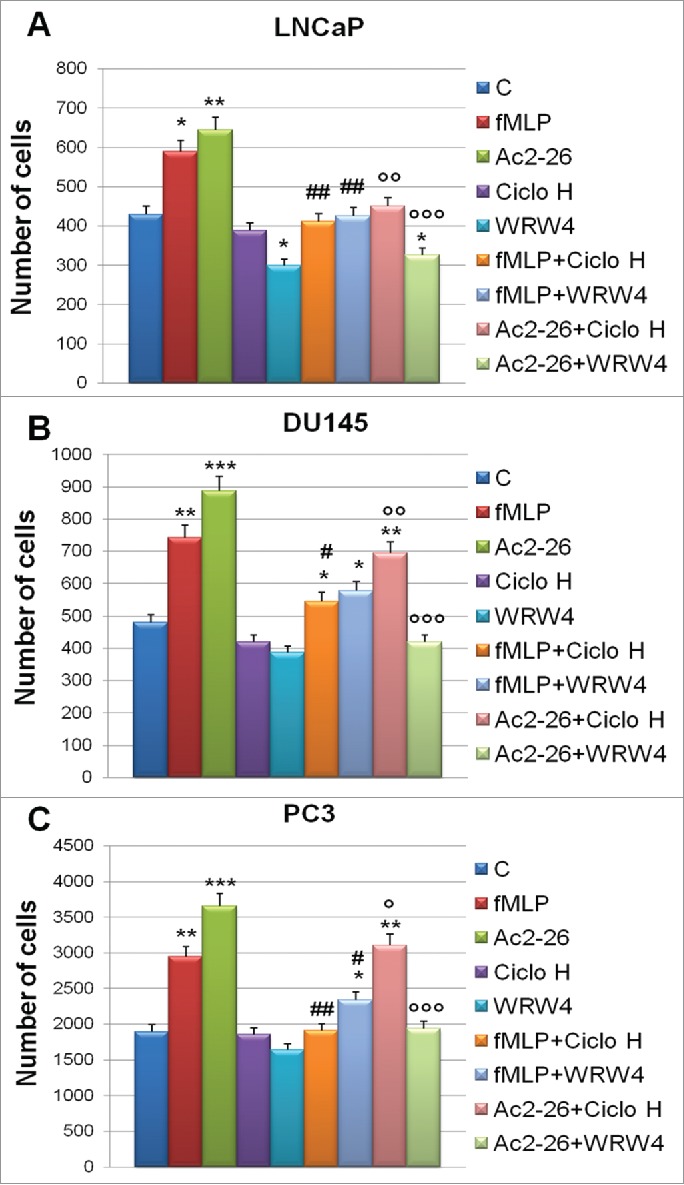
Figure 4.

Invasiveness rate of LNCaP (A), DU145 (B) and PC3 (C) cells exposed to hypoxia for 48 hours in the presence of FPRs agonists, as fMLP (50 nM) and Ac2–26 (1 µM), and antagonists as Ciclosporine H (CicloH; 500 nM) and WRW4 (10 µM). Data represent mean cell counts of 12 separate fields per well ± SEM of 5 experiments. *p < 0.05, **p < 0.01, ***p < 0.001 vs untreated cells; #p < 0.05, ###p < 0.005 vs fMLP treated cells and °p < 0.05, °°p < 0.01, °°°p < 0.001 vs Ac2–26 treated cells.
