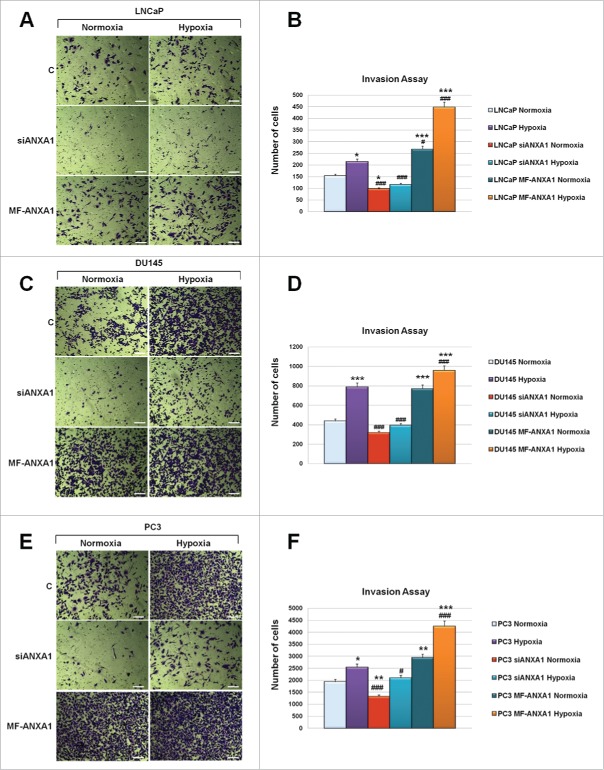
Figure 5.
Invasiveness rate of LNCaP, DU145 and PC3 cells transfected or not with siANXA1 and MF-ANXA1 plasmid, further incubated or not in hypoxia conditions. 48 hours from transfection correspond to invasion assay starting point whereas 48 hours refer to invasion assay ending one. Representative bright field images of invasion assay experimental end points for LNCaP (A), DU145 (C) and PC3 (E) cells. Invasiveness rate was determined by counting stained cells on the lower surface of the filters of LNCaP (B), DU145 (D) and PC3 (F) cells. Data represent mean cell counts of 12 separate fields per well ± SEM of 5 experiments. *p < 0.05, **p < 0.01, ***p < 0.001 vs untreated normoxia; #p < 0.05, ###p < 0.005 vs untreated hypoxia.

