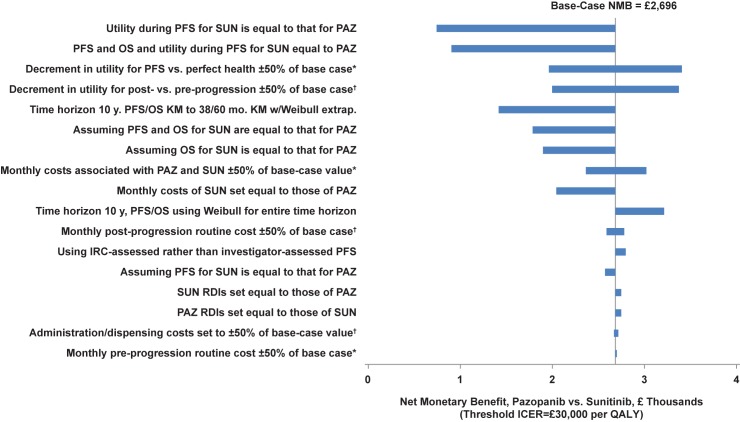
Fig 2. Tornado diagram for the NMB of pazopanib versus sunitinib.
IRC, independent review committee; KM, Kaplan–Meier; NMB, net monetary benefit; OS, overall survival; PAZ, pazopanib; PFS, progression-free survival; PTACT, post-treatment anti-cancer therapy; QALY, quality-adjusted life-year; RDIs, relative dose intensities; SUN, sunitinib. *Low value of parameter corresponds to low value of NMB; high value of parameter corresponds to high value of NMB. †Low value of parameter corresponds to high value of NMB; high value of parameter corresponds to low value of NMB.

