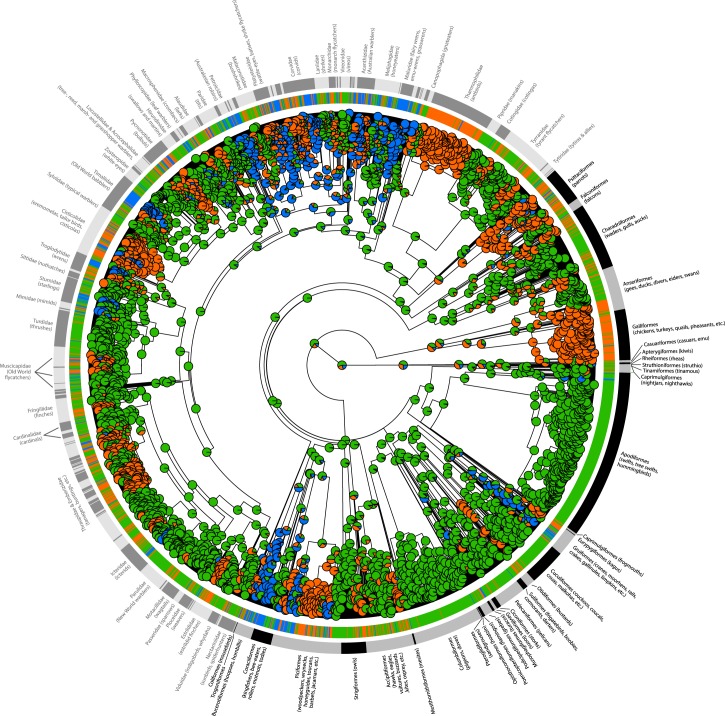
Fig 2. Ancestral state reconstruction (based on maximum likelihood) and estimated evolutionary transitions of bird social system (N = 2,968 species).
Pie charts plotted at each node represent the estimated posterior proportion of the 3 social systems: non-family living (green), family living (orange), and cooperative breeding families (blue).

