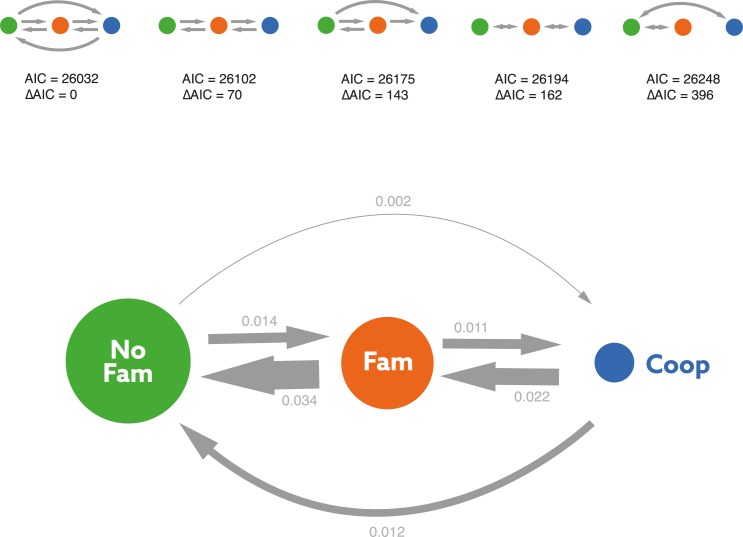
Fig 3.
Estimated transition rates of the best-fitting model (a) and statistical evaluation of the different transition models of the evolution of avian social systems (b). In the best-fitting transition model, arrow thickness is proportional to the estimated transition rates, and the size of the circles is proportional to the relative abundance of the 3 social systems among the species in the sample. No Fam = non-family living; Fam = family living; Coop = cooperative breeding families. Directions of the arrows indicate modelled transitions: a single arrow between 2 states pointing in both directions reflects transition rates constrained to be equal, a single arrow pointing in 1 direction reflects transitions only in 1 direction, and 2 arrows between states reflects unconstrained transition rates. AIC = Akaika information criterion.

