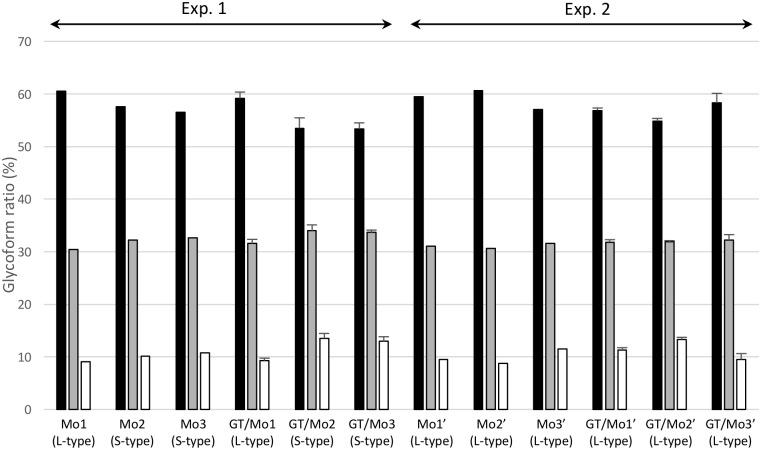
Fig 4. Glycoform profiles of PrPSc in mice infected with GT1-7 cell culture-derived S-type and L-type prions.
PrPSc glycoform percentages of original mouse brains used for the infection of GT1-7 cells (Mo1, Mo2, Mo3, Mo1′, Mo2′, and Mo3′) were compared to those of mouse brains inoculated with GT1-7 cell homogenates (GT/Mo1, GT/Mo2, GT/Mo3, GT/Mo1′, GT/Mo2′, and GT/Mo3′). Results of GT1-7 cell homogenate-inoculated mice are shown as the mean ± standard deviation (n = 4). The PrPSc glycoprofile of GT/Mo2-inoculated mice in this graph shows the mean glycoform ratio of the mice that developed S-type disease. The inoculum (brain or GT1-7 cells) was intracerebrally injected into ICR mice. Experiment numbers are the same as in Fig 1.bar graph shows di-glycosylated (black columns), mono-glycosylated (gray columns), and unglycosylated (white columns) forms of PrPSc. L- and S-type at the bottom of each lane indicate the disease phenotypes. PrPSc was detected with mAb T2-HRP.

