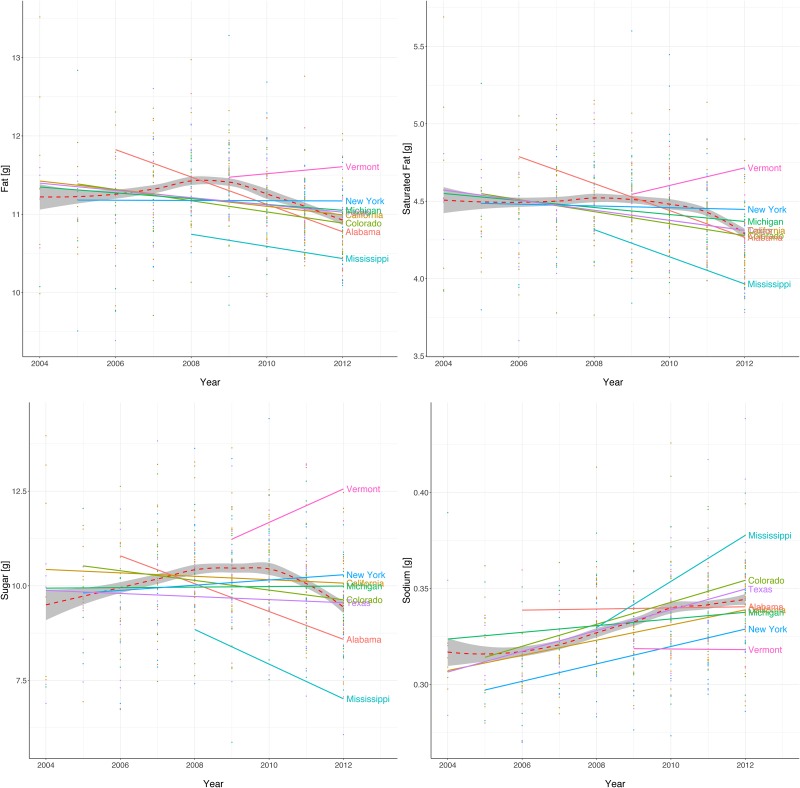
Fig 3. Trends for fat (top-left plot), saturated fat (top-right plot), sugar (bottom-left plot) and sodium (bottom-right plot) measured in 100g per recipe as a function of time (2004–2012) for the same selected US states as depicted in Fig 1.
The general aggregated trend is shown with a dashed line.

