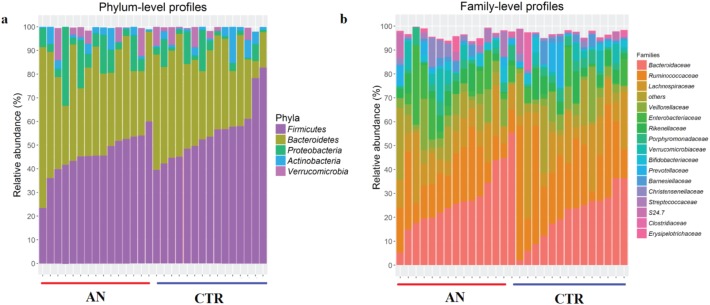
Fig 1. Relative abundance of common microbial taxa.
Bar charts showing the relative abundance of the most represented microbial taxa, defined as having a mean relative abundance of >1%, in stool samples of anorexia nervosa (AN, n = 15) and control (CTR, n = 15) groups. Phylum-level (a) and family-level (b) taxon profiles are shown.

