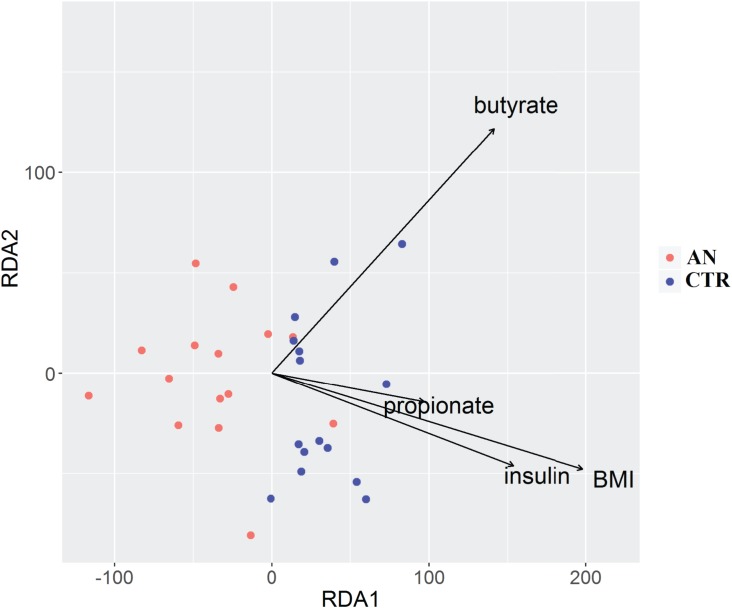
Fig 3. Distance-based redundancy analysis (db-RDA).
Db-RDA plot shows correlations between gut microbiota composition and body mass index (BMI), insulin, propionate and butyrate. Only significant variables are represented (p>0.05, Permanova analysis). Arrows in the db-RDA biplot denote the magnitudes and directions of the variable effects. Controls are represented by blue dots and anorexic subjects by red dots.

