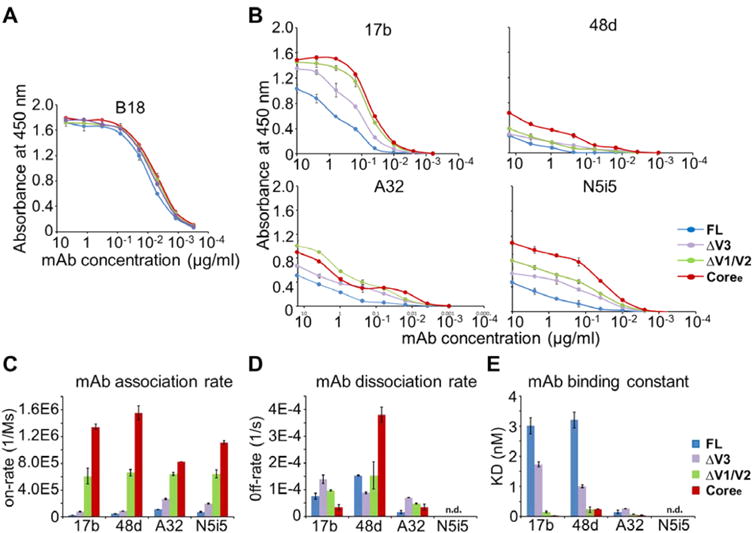
Figure 5.

gp120 loop truncation variants show dramatic differences in the binding of the antibody to conserved CD4i conformational epitopes. (A) Binding of FL, ΔV3, ΔV1/V2, and Coree to B18 antibody as determined by an ELISA. B18 binds a linear epitope in the inner domain. (B) Binding of FL, ΔV3, ΔV1/V2, and Coree to 17b, 48d, A32, and N5i5 as determined by an ELISA. The binding curves are colored by different gp120s. Antibody concentrations are shown on the x-axis. The absorbance at 450 nm is shown on the y-axis, representing antibody binding levels. The error bars represent standard deviations from duplicate independent measurements. (C–E) Binding to CD4i-binding antibodies measured by a Fortebio Octet biolayer interferometry platform. (C) Association rates (on-rate) for binding of FL, ΔV3, ΔV1/V2, and Coree to 17b, 48d, A32, and N5i5. (D) Dissociation rates (off-rate) for binding of the four gp120s to 17b, 48d, A32, and N5i5. (E) KD values for binding of the four gp120s to 17b, 48d, A32, and N5i5. Raw data and fitted curves are shown in Figure S6. Error bars represent standard deviations of two independent measurements.
