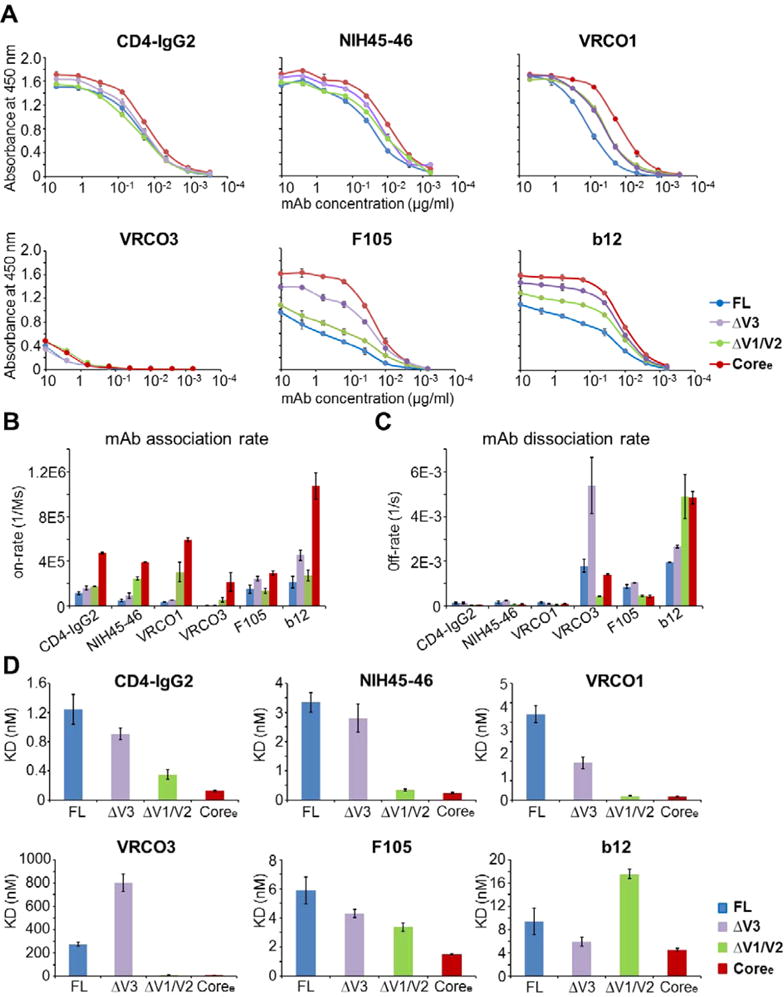
Figure 7.

gp120 loop truncation variants show dramatic differences in binding of the antibody to the CD4-binding site epitope. (A) Binding of FL, ΔV3, ΔV1/V2, and Coree to CD4-IgG2, NIH45–46, VRC01, VRC03, F105, and b12 (from left to right, respectively) as determined by an ELISA. The binding curves are colored by different gp120s. Antibody concentrations are shown on the x-axis. The absorbance at 450 nm is shown on the y-axis, representing antibody binding levels. The error bars represent standard deviations of duplicate independent measurements. (B–D) Binding to CD4bs antibodies measured by a Fortebio Octet biolayer interferometry platform. (B) Association rates (on-rate) for binding of FL, ΔV3, ΔV1/V2, and Coree to CD4-IgG2, NIH45–46, VRC01, VRC03, F105, and b12. (B) Dissociation rates (off-rate) for binding of the four gp120s to CD4-IgG2, NIH45–46, VRC01, VRC03, F105, and b12. (C) KD values for the four gp120s with CD4-IgG2, NIH45–46, VRC01, VRC03, F105, and b12. Raw data and fitted curves are presented in Figure S7. Error bars represent standard deviations of two independent measurements.
