

Abstract
Social isolation is a known stressor that negatively impacts the well-being of social species. In rodents, social deprivation experienced either before or after weaning profoundly impacts adult behavioral and neuroendocrine profiles. This study compared the effects of post-natal and post-weaning social deprivation on behavioral profiles and hypothalamic oxytocin (OT) neurons. Male and female Sprague-Dawley rats were assigned to two post-natal groups, maternally separated (MS) or non-MS. MS pups were separated from their mothers for 4 hours daily during post-natal days 2–21 while non-MS litters remained undisturbed. Animals were then weaned and assigned to single or group housing conditions (SH/GH). Social behaviors were evaluated two weeks later and at 2–3 months of age, depressive-like behavioral profiles were assessed using the forced swim and sucrose preference tests. Animals were euthanized, and hypothalamic OT neurons were quantified. Post-weaning isolation significantly impacted behavioral profiles, with SH animals displaying more social behaviors than GH animals. SH animals also exhibited more immobility behavior in the forced swim test and a decreased sucrose preference. Effects of sex and MS were relatively limited. Correlation analyses revealed an inverse relationship between the display of antagonistic social behaviors and the numbers of OT cells in the anterior parvicellular division of the paraventricular nucleus (PVNap). There were no correlations between numbers of OT neurons and prosocial or depressive-like behaviors. Our results demonstrate a rapid and persistent disruption of behaviors in SH animals and suggest that some of these effects may be associated with numbers of OT neurons in the PVNap.
Keywords: Oxytocin, rat, social behaviors, depressive-like behaviors
1. Introduction
Affiliative relationships are vital to the well-being of animals belonging to social species, and they depend on interactive relationships throughout their lifespans. Initial child-parent relationships are essential for offspring survival and normal development, and the need for integral relationships persists throughout adulthood. As individuals age, social relationships have as much impact on physical health as smoking, exercise, blood pressure and obesity [1]. Social support derived from primary relationships leads to increased productivity and a decrease in the prevalence of mental disorders [2], and individuals who are isolated from social support are more likely to develop mental illness and live shorter lives [3].
1.1 Developmental social deprivation
Neonatal and early post-natal social experiences are derived primarily through receipt of maternal care, and it is well established that maternal deprivation during early life impairs the development of normal social and emotional profiles. Studies in rodents that employ maternal separation (MS) as a neonatal stressor demonstrate that MS disrupts normal social development resulting in the increased display of aggressive behaviors. [4, 5]. In both humans and rats, abnormal social behavioral profiles associated with MS appear to be associated with the disruption of physiological stress responses. Early life stress caused by interruptions in maternal care alters functioning of the hypothalamic-pituitary-adrenal (HPA) stress axis [6–8]. MS increases HPA responses to stress, lowers stress resiliency, and is associated with the display of anxiety and depressive-like behaviors in both primates and rodents [9–12].
1.2 Adult social deprivation
Similar adverse effects are seen when rodents are subjected to social isolation in adulthood. Rats are highly social animals that normally display a rich variety of interactive behaviors. As rat pups gain independent mobility towards the end of the second week of life, they begin to engage in playful interactions with one another. These social interactions increase in complexity during the post-weaning period, with juvenile rats displaying a broad array of both agonistic and antagonistic social play behaviors (for review, see [13, 14]). Rats continue to engage in social activities into adulthood, and display a significant preference for social contact over other forms of environmental enrichment [15]. They live and sleep in groups, establish dominance hierarchies, and exhibit cooperative behaviors [16]. These social relationships are important for the functioning of the colony, but also appear to be important to the wellbeing of individual animals [17]).
Social isolation in rats is a known stressor that causes hypersensitivity of the hypothalamic-pituitary-adrenal (HPA) axis and alters neurotransmitter systems related to stress, anxiety and depression [6, 14, 17]. Single housing of rats and mice has been shown to increase aggressive social behaviors [4, 18] and cause long-term changes in behavior and physiology consistent with stress hyper-reactivity [19–22]. Individual housing of rodents in the laboratory environment is now considered to be such a significant stressor that current guidelines of the National Research Council of the National Academies require it to be a justifiable necessity [23].
1.3 Oxytocin and sociality
A broad body of research has investigated the neurobiology of social interactions in rodents. The display of social behaviors likely reflects the combined actions of monoaminergic and peptidergic neurotransmitters in cortical and limbic brain areas that process rewarding and/or negative experiences. In recent years, attention has focused increasingly on the role of oxytocin (OT) as a mediator of sociality. OT is a hypothalamic nonapeptide that is most widely recognized for its peripheral effects related to reproductive function. These peripheral actions are attributable to magnocellular OT neurons in the paraventricular and supraoptic nuclei of the hypothalamus (PVN, SON) that project to the posterior pituitary gland. However, a growing body of literature demonstrates an important role for centrally projecting parvicellular neurons of the PVN in mediating the behavioral effects of OT. OT receptors are widely distributed throughout the forebrain [24–26], and studies in both rodents and humans suggest an important role for centrally released OT in regulating reproductive and maternal behaviors, social interactions and the formation of social bonds (see [27, 28] for review).
The mechanisms through which OT influences sociality are not fully understood but may involve its role in neuroendocrine responses to stress. Central release of OT leads to a reduction in anxiety and stress reactivity that appears to be mediated through the HPA axis [29]. OT inhibits CRH responses to stress and diminishes stress-induced activity of the HPA axis in both humans [30], and rats [29]. These effects may serve to increase resiliency to stress, supporting the possibility that OT may also exert anti-depressive effects [31–33]. Perturbations in the HPA axis are believed to be a fundamental neurobiological irregularity of depression [34–36]. Consequently OT may play a compelling role in the etiology of depression because of OT’s pivotal role in mammalian social behavior and its ability to attenuate the HPA axis’ stress response.
1.4 Experimental aims
The aim of the present studies was to compare the effects of post-natal and post-weaning social deprivation on the subsequent display of social play and depressive-like behaviors in rats and to investigate possible correlations between behavioral effects and numbers of hypothalamic OT neurons. MS and non-MS pups were weaned into either a single housed (SH) or group housed condition (GH) using a cross balanced design. Animals were tested for a wide array of agonistic and antagonistic social behaviors using a standard social play testing paradigm. Animals were then tested for depressive-like behaviors in the forced swim test and sucrose preference test. Brain sections containing the PVN and SON were immunostained for OT immunoreactivity (OT-ir), and numbers of OT-ir cells in the PVN and SON were quantified stereologically.
2. Materials and Methods
2.1 Experimental overview
A schematic diagram depicting the timeline of experimental procedures is presented in Figure 1. The day of birth for each litter was designated as post-natal day (PND) 0. As shown, newborn offspring were cross-fostered on PND 1 to generate 8 experimental litters of 10 pups each (n=80), with each litter comprising 5 male pups and 5 female pups. Maternal separation (MS) or controlled non-separation (non-MS) procedures occurred daily from PND 2 to weaning on PND 21. Animals were weaned on PND 21 and using a cross balanced design, were housed either singly or in groups for the remainder of the experiment. All experimental animals were tested once for social play behaviors between PND 33 and PND 38. Animals were then tested once in the forced swim test between PND 60 and PND 64, followed by a sucrose preference test between PND 79 and 81. All animals were euthanized between PND 103 and 107.
Figure 1.

Schematic timeline of experimental procedures. Maternal separation (MS) occurred from PND 2-PND 21, and subsequent group or single postnatal housing conditions (GH, SH) were employed from weaning on PND 21 to euthanasia on PND 103–107. Behavioral tests were performed on PND 33–38 (social play test), PND 60–64 (forced swim test) and PND 79–81 (sucrose preference test). Quantification of OT-immunoreactive (OT-ir) cells was performed on half of the animals from each group. Group numbers (n) are collapsed across sex, with equal numbers of males and females represented across all four treatment groups.
2.2 Animals
Experimental animals were the offspring of 12 timed pregnant Sprague-Dawley rats (Harlan Laboratories, Indianapolis, IN). Upon arrival on gestational day (GD) 15, dams were housed in pairs until GD 18 and were then single housed from GD 19 until parturition. The animals were housed on a 12 hr light cycle (lights on at 0800 h) in standard cages (43 × 20.5 × 20 cm) with ¼ inch corn cob bedding (Harlan Laboratories) with access to food (Teklad LM-485 mouse/rat serializable diet, Harlan Laboratories) and water ad libitum. The animal housing room was maintained at 20–26 °C with 50% controlled humidity throughout the experiment. Animal care and maintenance was in accord with the Animal Welfare Act and the U.S. Department of Health and Human Services “Guide for the Care and Use of Laboratory Animals” [23], and all experimental procedures were consistent with National Institute of Health guidelines and approved by the Howard University Institutional Animal Care and Use Committee.
On PND 1, litters were culled and pups were cross-fostered so that each dam had a litter of five males and five females. Culled pups were euthanized by lethal injection with the euthanasia drug SomnaSol (active ingredients: 390 mg/ml sodium pentobarbital and 50 mg/ml phenytoin; Henry Schein Animal Health, Dublin, Ohio) and were then rapidly decapitated to ensure death. Pups from eight of the litters (n=80) were included in the experiment, and eight additional pups (four males and four females) were housed in same sex groups to be used as conspecific stimulus animals for social play testing.
2.3 Post-natal and post-weaning social deprivation
Four of the eight experimental litters (n=40 pups) were randomly assigned to undergo post-natal social deprivation through maternal separation (MS). MS was performed from PND 2 through PND 21 for four hours daily (0800h to 1200h) based on the protocol of Leussis et al. [10]. During MS treatment, the dam was gently removed from the home cage and placed in an individual cage in a separate room while the pups remained in their home cages with their littermates. The other four litters (non-MS, n=40 pups) remained unseparated from their mothers until weaning at three weeks of age.
All pups were weaned on the afternoon of PND 21. The 80 weanlings were ear tagged for identification, placed on a reversed light cycle in preparation for behavioral testing (lights on from 2000h to 0800h), and assigned to be housed either singly (SH) or in same-sex groups of three or four (GH) using a cross balanced design. This generated four experimental groups of 10 males and 10 females each: maternally separated and singly housed, maternally separated and group housed, non-maternally separated and singly housed, and non-maternally separated and group housed. Animals remained in these housing conditions for the remainder of the experiment.
2.4 Social Play Testing
A single social play test (SPT) was performed on each animal between PND 33–38. Testing took place in a darkened room illuminated with red lamps. For the duration of each day’s testing session, experimental and conspecific stimulus animals were placed in separate individual cages with free access to food and water. All animals were habituated to the testing room for 30 minutes, and the backs of the conspecifics were marked with a black marker for visual identification. Each conspecific animal was used no more than twice on any testing day.
SPT was conducted in a testing chamber (30 × 20 × 55 cm) that was filled with ¼ inch of clean bedding. Following habituation, the conspecific animal was placed in the clean testing cage followed by the test animal. Behaviors of the test animal were then recorded for 15 minutes using software that allowed for the timestamped recording of each behavioral event. Eleven standard social behaviors were recorded by two independent observers: approach, box, chase, climb under, climb over, fight, groom, pin, reject, run away and sniff. Because pinning was a frequent constituent of fighting, the frequencies of these two behaviors were added together to generate values for a single measure (fight/pin). Scores from the two observers were then averaged to generate one final score for each behavior. After each test, the testing animal and conspecific animal were returned to their cages, and the testing cage was emptied, cleaned with a 95% alcohol solution and replenished with clean bedding.
2.5 Forced Swim Test
Each experimental animal was tested once in the forced swim test (FST) between PND 60–64. Because the animals did not receive any antidepressant treatments and their post-natal and post-weaning conditions remained constant once assigned, the FST was performed using a single-test paradigm [37, 38]. Prior to testing, each rat was placed in an individual cage in the testing room with free access to food and water. All animals were habituated to the testing room for thirty minutes. For testing, each rat was gently introduced into a clear plexiglass cylinder measuring 17 cm in diameter and 60 cm in height that was filled to 30 centimeters with room temperature water (25 ± 1°C), and active (swimming or climbing) and passive (immobility) behaviors were recorded once every five seconds for the duration of a five minute testing session. An observer who was blind to the experimental conditions of the animals scored each behavioral event as mobility if there were swimming or upward-directed climbing movements, and immobility was scored when there was a total lack of movement or the animal displayed only enough activity to keep its head above water. Behavioral observations from each 5-second epoch of the test were summated, and the percent immobility (# immobility events/total # events × 100) was calculated for each animal [39, 40].
2.6 Sucrose Preference Test
A 24h sucrose preference test (SUT) was performed once on each animal between PND 79–81. For three days prior to the SUT, rats were habituated to the presence of two drinking bottles; one bottle contained 1% sucrose and the other contained only water. The SUT was conducted immediately after habituation. During the 24h testing period, all animals were placed in individual cages with food available ad libitum. The cages allowed equal free access to the 1% sucrose solution (weight/volume) and the bottle containing only water.
Measures of sucrose preference (1% sucrose consumption/total liquid consumption × 100) were collected at 6, 12, and 24 hours. At each time point, an observer blind to treatment conditions weighed the bottles to determine the amount of liquid consumed. The positions of the two drinking bottles were switched halfway between each time point to reduce any confound produced by side bias.
2.7 Perfusion and tissue collection
Experimental animals were euthanized by transcardial perfusion between PND 103–107 using previously published methods [41]. All cage mates were euthanized on the same day to maintain consistent experimental housing conditions throughout the study. Each animal was deeply anaesthetized with SomnaSol and when the animal was completely unresponsive to a toe pinch stimulus, the thoracic cavity was opened and the animal was perfused transcardially with 0.9% saline followed by ~400 mL 4% paraformaldehyde. Brains were collected and post-fixed at 4°C for four hours in 25% sucrose in 4% paraformaldehyde. They were then placed in 25% sucrose in 0.02M potassium phosphate buffered saline (KPBS) and incubated at 4°C overnight. The following day, the brains were rapidly frozen in powdered dry ice and stored at −80°C.
Frozen brains were sliced into 40 μm sections using a sliding microtome (Leica Microsystems Inc., Buffalo Grove, IL). A small hole was placed on the right cortical surface of each brain before cutting to facilitate consistent orientation of the sections on slides. For each brain, three sequential series of sections were collected from the prefrontal cortex through the entire forebrain at an angle corresponding to the atlas of Swanson [42]. Sections were then stored at −20°C in an antifreeze solution (20% glycerol and 30% ethylene glycol in 0.02M KPBS) until immunohistochemical processing.
2.8 Immunohistochemistry
Half of the experimental animals (n = 40) from the experiment were selected for immunostaining and anatomical analysis. The animals selected included 5 males and 5 females from each of the four post-natal/post-weaning treatment groups. Sections from one series per animal that encompassed the entire PVN and SON were selected and immunostained using a previously published protocol from our lab [43]. Prior to each stage of the process, sections were washed for 1h in frequent changes of 0.02M KPBS. Sections were pre-incubated overnight at 4°C in 0.02M KPBS containing 2% normal goat serum and 0.3% Triton-X (LKPBS) along with 1% H2O2 to eliminate endogenous peroxidase activity. Following pre-incubation, sections were placed in a rabbit polyclonal antibody generated against a synthetic OT peptide (1:100,000 in LKPBS; ImmunoStar, Hudson, WI) at 4°C for 48–72h. Sections were then incubated in a biotinylated goat anti-rabbit IgG secondary antibody (1:200 in KPBS; Vector Laboratories; Burlingame, CA) for 2 hours at room temperature, followed by a 90 minute incubation at room temperature in avidin-biotin complex (Vectastain Elite ABC kit, Vector Laboratories) to amplify the biotin label.
OT-ir cells were visualized using a DAB (diaminobenzidine) Peroxidase Substrate Kit (Vector Laboratories) with nickel enhancement. For every four animals, 6 drops of buffer stock solution, 24 drops of DAB stock, 12 drops of H2O2 solution and 12 drops of nickel solution were added to 30 mL of distilled water. Free-floating tissue sections were incubated in the DAB solution for 3–3.5 minutes to allow suitable staining to develop. Sections were then rinsed overnight in KBPS and mounted onto gelatin coated glass slides. Prior to coverslipping with DPX mountant (Sigma-Aldrich; St. Louis, MO), sections were lightly counterstained with cresyl violet to aid in the identification of anatomical landmarks and nuclei of interest.
2.9 Stereology
The StereoInvestigator design based stereology system (MicroBrightField Inc., Williston, VT) was used to estimate total number of OT cell bodies in the PVN (every 3rd section) and SON (every 6th section) of each animal. The PVN was subdivided into two regions for analysis, the anterior parvicellular division (PVNap) and the main cell groups of the PVN (PVNproper: dorsal, lateral and medial parvicellular divisions and anterior, medial and posterior magnocellular divisions; [44]; See Figure 2). Contours were drawn around each region of interest (ROI) and cell counts within the contours were performed using the optical fractionator probe [45]. Parameters for the probe (grid layout and XY dimensions of the counting frame) were established prior to counting. For the PVNap, the grid size was 40 × 40 μm and the counting frame size was 30 × 30 μm. For the PVNproper, the grid size was 100 × 100 μm and the counting frame was set at 30 × 30 μm and for the SON, the grid size was 85 × 85 μm and the counting frame size was 30 × 30 μm. The height of the disector was determined for each animal by measuring the thicknesses of all of the sections. The disector height was set to be two microns less than the minimum section thickness for each ROI, ensuring guard zones of at least one micron above and below the counting frame. These counting frame parameters and sampling frequencies yielded coefficients of error (CE) of 0.10 or less for all estimates of cell numbers in the PVNproper and SON (Gundersen CE, m=1). For the PVNap, 5 animals that had CE values greater than 0.10 were removed from the analysis.
Figure 2.

Distribution of OT-ir cells in the PVN and SON that were quantified stereologically. PVNap: anterior parvicellular division of the PVN; PVNproper: main cell groups of the PVN; SON: supraoptic nucleus; 3v: third ventricle; fx: fornix; opt: optic chiasm. Scale bar = 500 μm
Once the optical fractionator parameters were established, cell counts were performed at each sampling site using a 100X oil immersion objective (N.A. = 1.40), and estimated numbers of OT cells in the PVNap, PVNproper and SON were recorded for each animal.
2.10 Data Analysis
All statistical analyses were performed using SigmaStat® SPSS Inc. (Chicago, IL). The level of statistical significance was set at p ≤ 0.05. Data from the behavioral testing and OT neuronal cell counts were initially analyzed by three-way ANOVA (sex × MS treatment × housing), and interactions and main effects were further analyzed with 2-way and 1-way ANOVAs where appropriate. 1-way analyses of main effects consistently failed the assumptions of equal variance and/or normal distribution, so all main behavioral effects from the SPT, FST and SUT were reanalyzed using Mann-Whitney nonparametric analysis on ranks. All animals were included in the analyses without the removal of outliers.
Potential relationships between individual animals’ behavioral profiles and numbers of parvicellular OT-ir neurons were explored through Pearson and Spearman correlation analyses (number of PVNap OT-ir cells × number of behavioral events). When the correlation data failed the assumptions of normal distribution required for the Pearson test, results from the Spearman test were used.
3. Results
3.1 Social Play Test
All social play data were subjected initially to 3-way ANOVAs (sex × MS treatment × housing condition), and strong main effects of housing were indicated for all of the social play behaviors. Subsequent Mann-Whitney tests confirmed a main effect of housing condition for all ten behaviors. As shown in Figure 3, single housed animals displayed significantly higher frequencies of each behavior than did group housed animals (p < 0.001 for all behaviors). For chase and run away behaviors, there was also a main effect of sex. Females exhibited significantly more chase and run away behaviors than males (Figure 4).
Figure 3.


Box plot representations demonstrating the effect of housing condition on all 10 social play measures. Single housed animals (n = 40) exhibited more of each behavior than group housed animals (n = 40). Middle line in the box represents the median; lower box bounds the first quartile; upper box bounds the 3rd quartile. Lower and upper whiskers represent the 10th and 90th percentiles, respectively. All outliers (closed circles) were included in the analyses. ***Significant difference between groups; p ≤ 0.001.
Figure 4.

Effects of sex on chase (top) and run away (bottom) behaviors. Females (n = 40) exhibited these behaviors more than males (n = 40). Middle line in the box represents the median; lower box bounds the first quartile; upper box bounds the 3rd quartile. Lower and upper whiskers represent the 10th and 90th percentiles, respectively. All outliers (closed circles) were included in the analyses. **Significant difference between groups; p ≤ 0.01; *Significant difference between groups; p ≤ 0.05.
No main effects of MS were observed for any of the ten social play behaviors. However, significant 2-way interactions between MS treatment and housing condition were found for groom and sniff behaviors. For both behaviors, Holm-Sidak post-hoc tests revealed that effects of MS were seen only in single housed animals; MS did not affect grooming or sniffing behaviors in group housed animals (Figure 5).
Figure 5.
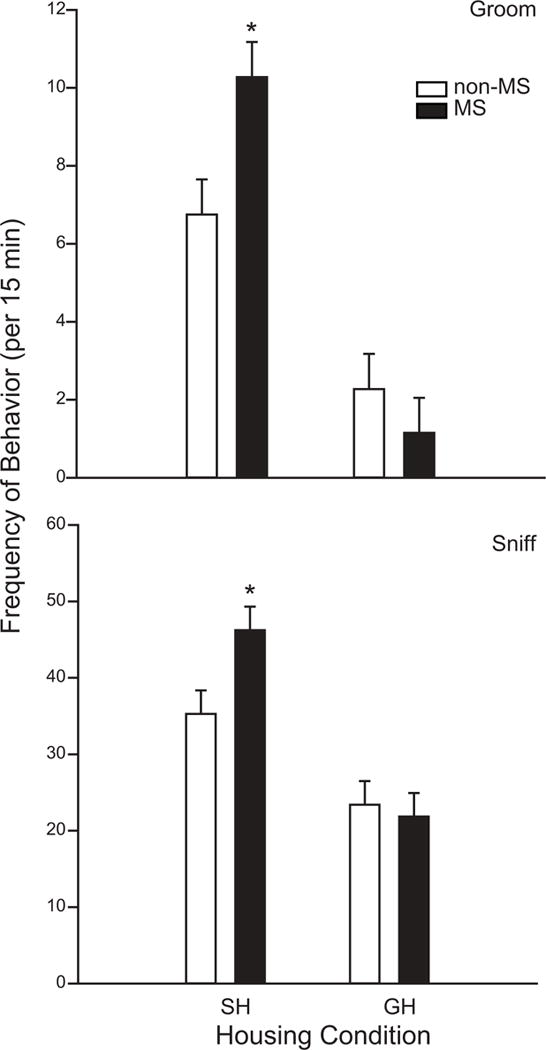
Two-way interactions between MS treatment and housing condition on groom (top) and sniff (bottom) behaviors. MS animals in the SH condition displayed more groom and sniff behaviors. There was no effect of MS among GH animals. *Significant difference between NS and non-MS animals; p ≤ 0.05, n = 20 per group.
3.2 Forced Swim Test
Data on % immobility in the FST are presented in Figure 6. 3-way ANOVA indicated main effects of both housing and sex, and these effects were confirmed through Mann-Whitney nonparametric analyses. As shown, single housed animals spent a significantly greater percentage of time exhibiting immobility than group housed animals, and females had significantly higher % immobility than males (p ≤ 0.05). Three was no effect of MS treatment on % immobility in the FST.
Figure 6.

Effects of housing and sex on % immobility observed in the forced swim test. Single housed animals exhibited greater % immobility than group housed animals (n = 40 per group), and females showed greater % immobility than males (n = 40 per group). Middle line in the box represents the median; lower box bounds the first quartile; upper box bounds the 3rd quartile. Lower and upper whiskers represent the 10th and 90th percentiles, respectively. All outliers (closed circles) were included in the analyses. *Significant difference between groups; p ≤ 0.05.
3.3 Sucrose Preference Test
Results from the SUT are presented in Figure 7. As shown, a significant main effect of housing condition was seen at both 6h (p ≤ 0.01) and 12h (p ≤ 0.05). At both time points, single housed animals showed a reduced sucrose preference compared to group housed animals. Effects of housing on sucrose preference were no longer observed at 24 h. There were no effects of sex or MS treatment on sucrose preference at any time point.
Figure 7.

Effects of housing on sucrose preference across 24 hours. At 6h and 12h, SH animals had a lower sucrose preference than GH animals (n = 40 per group). There was no effect of housing on sucrose preference at 24h. Middle line in the box represents the median; lower box bounds the first quartile; upper box bounds the 3rd quartile. Lower and upper whiskers represent the 10th and 90th percentiles, respectively. All outliers (closed circles) were included in the analyses. **Significant difference between groups; p ≤ 0.01; *Significant difference between groups; p ≤ 0.05.
3.4 Numbers of OT-ir cells
Numbers of OT-ir cells in the PVNap, PVNproper and SON are presented in Table 1 (mean ± sem) and Figure 8. Three-way ANOVA revealed that there were no main effects of sex, MS treatment or housing condition on numbers of OT-ir cells in the PVNproper or in the SON, nor were there any significant interactions between factors. In contrast, a significant main effect of housing was indicated in the PVNap [F(1,34)=4.978, p=0.034]. Numbers of PVNap OT cells in group housed animals ranged from approximately 1000 to 5000 whereas for single housed animals, PVNap cell counts were all less than 3500. Subsequent Mann-Whitney nonparametric analyses, however, revealed this effect to be statistically non-significant (p=0.113, not shown).
Table 1.
Numbers of OT-ir cells (mean ± sem) in the PVNap, PVNproper and SON across the eight experimental groups.
| Maternally Separated | Non-maternally Separated | |||||||
|---|---|---|---|---|---|---|---|---|
| Group Housed | Single Housed | Group Housed | Single Housed | |||||
| Male | Female | Male | Female | Male | Female | Male | Female | |
| # OT Cells | ||||||||
| PVNap | 3220.56 ± 769.31 | 3055.06 ± 1186.77 | 1969.24 ± 235.84 | 1794.31 ± 147.03 | 2251.31 ± 369.69 | 2281.59 ± 335.05 | 1893.42 ± 245.06 | 2231.13 ± 348.92 |
| PVNproper | 8737.67 ± 1124.13 | 11992.42 ± 2535.80 | 7169.20 ± 1124.60 | 8063.42 ± 1358.48 | 1340.71 ± 1340.17 | 8692.85 ± 489.21 | 9229.62 ± 1675.53 | 8863.40 ± 792.86 |
| SON | 8175.30 ± 863.50 | 7214.15 ± 814.50 | 6512.66 ± 890.78 | 6408.66 ± 856.54 | 7792.20 ± 1204.80 | 6742.92 ± 981.70 | 7302.19 ± 788.14 | 5516.79 ± 408.19 |
Figure 8.

Inverse correlations between #OT-ir cells in the PVNap and the display of social play behaviors (n = 35). PCC: Pearson correlation coefficient; SCC: Spearman correlation coefficient. All SH animals (gray circles) and GH animals (black circles) were combined for the correlation analyses.
3.5 Correlation analyses
Results from correlation analyses (frequency of behavior x # PVNap OT-ir cells) are presented in Figure 8. Significant inverse correlations existed between the numbers of PVNap OT cells and the frequency with which animals displayed approach, box, chase, run away, reject and fight/pin behaviors (p ≤ 0.05). Animals with lower numbers of OT-ir cells showed these behaviors more frequently than those with higher numbers of OT-ir cells. There was no correlation between the numbers of PVNap OT-ir cells and the frequencies of sniff, groom, climb under or climb over behaviors, nor was there any correlation between the numbers of OT-ir cells and measures of depressive like behaviors in the FST or SUT (not shown).
4. Discussion
This experiment compared the effects of post-natal and post-weaning social isolation on the display of social play behaviors and the numbers of hypothalamic OT neurons. Previous studies have demonstrated that group housing or environmental enrichment can alleviate the physiological and behavioral effects of a prior social stressor [19, 46]. In the present study, we hypothesized that social enrichment in the form of group housing would be effective in improving social deficits seen in MS animals. However, the predicted interactions between MS and housing condition were observed only for sniffing and grooming behaviors. The effects of MS on these two behaviors were observed only in SH animals, whereas we saw no effect of MS on sniffing and grooming in GH animals. Our data support the premise that GH can reduce the negative impact of MS for some behaviors. Both sniffing and grooming are typically characterized as affiliative behaviors, suggesting that the benefits of GH may be to promote agonistic behaviors. It does not appear, however, that these effects result from changes in the numbers of OT neurons, as correlations between numbers of OT neurons in the PVNap and the frequencies of sniffing and grooming behaviors were not observed.
Housing was by far the most significant factor in disrupting social play and inducing depressive-like behaviors. SH animals exhibited increased frequencies of all behaviors observed in the SPT, FST and SUT. In the SPT, SH rodents displayed markedly high frequencies for all behavioral measures, irrespective of whether the behaviors were agonistic or antagonistic. Social isolation through single housing is known to cause increased exploration and elevated physiological stress responses to a novel environment [19]. Animals in the SPT test had not been previously exposed to the testing environment or the conspecific animals, so it is possible that the novelty of the testing situation elicited hyperactive behavioral profiles. However, generalized behavioral hyperactivity was not observed in SH animals in the FST, during which they displayed increased immobility compared to GH animals. Rather, our data are consistent with the premise that SH leads to abnormally enhanced activation of the HPA axis and stress hyper-reactivity [19–22].
Effects of sex were not observed for the majority of social play behaviors examined. This may be due to the timing of the SPT. Because our experimental design required that animals enter into their post-weaning housing conditions before the onset of behavioral testing, our SPT test was performed on PND 33–38. Previous groups demonstrate an emergence of sex differences in play behavior that is evident in weanlings but that does not persist into the post-weaning juvenile period [47], which may explain the limited sex effects on social play observed in the present study. We did observe a sex effect for run away and chasing behaviors, which were exhibited more by females. These behaviors are among those for which we report an inverse correlation with numbers of OT-ir cells in the PVNap. However, it is unlikely that the increased display of running away and chasing seen in females was due to changes in numbers of OT-ir neurons as we found no effect of sex on numbers of OT-ir cells in the PVNap (p = 0.98) or any other area.
We also saw an effect of sex in the FST, with females exhibiting a greater degree of immobility than males. This finding is consistent with human and animal studies that demonstrate an increased prevalence of depression and depressive-like behaviors in females. This may be due to elevated HPA responsiveness in women [48–50]. Interestingly, social isolation can further exacerbate females’ vulnerability to depression, which may reflect additive effects of isolation and sex on stress responses [51]. Previous groups have reported a potential role for OT in the etiology of depression [31–33]. However, we found no sex differences in numbers of OT-ir neurons in the hypothalamus and no correlation between numbers of OT-ir neurons and measures of depressive-like behaviors. An important consideration in interpreting this finding is that we did not examine OT receptor number or binding capacity in the present experiment. Further studies examining OT receptor binding profiles are necessary to better understand how OT may exert antidepressant properties in the social isolation model.
We did not observe a main effect of MS on any behavioral measure. This finding is surprising, as a wealth of literature has described the behavioral consequences of MS treatment. However, the results of studies that employ MS paradigms are often inconsistent. For example, MS has been shown to increase offenses play behaviors and intermale aggression in rats [5, 52], but opposite effects are reported for mice [53, 54]. This may be attributable to differences in species or differences between MS experimental protocols. There is great variability in the methodological details used in studies that employ MS, and interpretation of literature in the field often requires distinguishing between substantially different experimental paradigms (see [55] for review). In the present study, we employed an MS protocol in which we did not remove litters from their home cages during the period of separation, but only removed the dams. Our goal was to examine effects that could be attributed solely to maternal deprivation and would not elicit changes due to social isolation or exposure to a novel environment. We also extended the period of MS until weaning on PND 21. Pups were therefore able to function fairly independently and interact socially during their third week of life. These features of our methodological approach may have minimized the stress associated with MS, allowing for relatively normal social development. However, our methodology also differed from commonly used MS protocols in that our dams were bred off site and shipped while pregnant. The shipping of the animals during pregnancy may have introduced prenatal stress that was not a factor in some other studies. The effects of in utero transport of rodents have not been investigated thoroughly, but shipping during pregnancy has been shown to alter neurodevelopment in the offspring [56, 57], possibly through mechanisms related to prenatal stress [58]. It is possible, therefore, that the confounding effects introduced by the use of timed pregnant shipped animals may have masked the effects of the post-natal MS stressor.
OT-ir in the PVN has been shown previously to be sensitive to MS [53] and neonatal handling [59], but these effects have not been consistent across studies (see [60] for review). In the present study, effects of housing on numbers of OT-ir neurons in the PVNap did not achieve statistical significance. This may be due to our quantification of only a subset of parvicellular OT neurons in the PVN. While PVNap contains only parvicellular neurons, groups of parvicellular neurons are also found in the PVNproper. We did not distinguish OT-ir cell type in the PVNproper, so cell counts reflected both magnocellular and parvicellular neuronal populations. It is therefore possible that we would have observed a stronger effect of housing on OT-ir had we quantified all of the parvicellular cell groups of the PVN. We also saw no significant effect of sex in the PVNap or any other area. Anatomical analyses were run on only half of the animals (n = 40) and with respect to the PVNap, we were able to quantify only 35 out of the 40 animals. This yielded only 3–5 animals of each sex for some groups, and these marginal n numbers may have contributed to the lack of statistically significant effects revealed in our Mann-Whitney analyses. However, the neurostereological approaches that we employed represent state-of-the-art quantitative anatomical analyses designed to minimize methodological variance [61] and given the magnitude of the p-value for effects of sex on PVNap OT cell number (p = 0.98), it is unlikely that higher n numbers would have revealed a statistically significant sex difference. We also found no effect of treatment or sex on OT-ir cells in the SON. A previous study on bipolar and major depression patients found a 50% decrease in total neuron number in the PVN but did not report any difference in numbers of cells in the SON [62], suggesting that magnocellular neurons found in the SON may not play a role in the etiology of depression.
5. Conclusions
Depression and anxiety can be characterized by impaired social behavior but social relationships may buffer these effects. In the present study, we demonstrate a significant negative correlation between numbers of PVNap OT-ir neurons and behavioral profiles. Interestingly, this inverse relationship was observed primarily for antagonistic behaviors such as boxing and fighting/pinning. We saw no relationship between the numbers of OT-ir cells and the display of prosocial behaviors. This finding is significant, as it sheds light on the variable results from studies that attempt to correlate OT neurobiology with social behaviors. OT is typically thought to promote positive social interactions, social bonding and trust. The present results suggest that these influences are not reflective of OTergic enhancement of agonistic social behaviors but rather, that OT exerts these effects through the inhibition of antagonist behaviors. Since OT has a crucial role in social behavior and in attenuating the HPA axis’ stress response, these findings support the use of OT as a potential therapeutic approach for humans suffering from disorders such as autism and depression that are characterized by impaired sociality and heightened social antagonism.
Acknowledgments
We would like to express our sincere gratitude to Mr. Leo Apolonio for providing the software used for collection of the behavioral data and Ms. Ashleigh Ntim-Addae, who assisted with the tissue preparation and immunostaining procedures. We also wish to thank the Veterinary Service staff at Howard University College of Medicine (HUCM) for their assistance with the care and housing of our animals. This work was supported by NSF IGERT training grant #0006461 and NIH RCMI award #5G12MD00759728 to HUCM and by faculty awards U400022 and U400044 to EKP.
Footnotes
Publisher's Disclaimer: This is a PDF file of an unedited manuscript that has been accepted for publication. As a service to our customers we are providing this early version of the manuscript. The manuscript will undergo copyediting, typesetting, and review of the resulting proof before it is published in its final citable form. Please note that during the production process errors may be discovered which could affect the content, and all legal disclaimers that apply to the journal pertain.
References
- 1.House JS, Landis KR, Umberson D. Social relationships and health. Science. 1988;241(4865):540–5. doi: 10.1126/science.3399889. [DOI] [PubMed] [Google Scholar]
- 2.Baumeister RF, Leary MR. The need to belong: desire for interpersonal attachments as a fundamental human motivation. Psychological bulletin. 1995;117(3):497–529. [PubMed] [Google Scholar]
- 3.Cacioppo JT, Hughes ME, Waite LJ, Hawkley LC, Thisted RA. Loneliness as a specific risk factor for depressive symptoms: cross-sectional and longitudinal analyses. Psychology and aging. 2006;21(1):140–51. doi: 10.1037/0882-7974.21.1.140. [DOI] [PubMed] [Google Scholar]
- 4.Haller J, Harold G, Sandi C, Neumann ID. Effects of adverse early-life events on aggression and anti-social behaviours in animals and humans. J Neuroendocrinol. 2014;26(10):724–38. doi: 10.1111/jne.12182. [DOI] [PubMed] [Google Scholar]
- 5.Veenema AH, Neumann ID. Maternal separation enhances offensive play-fighting, basal corticosterone and hypothalamic vasopressin mRNA expression in juvenile male rats. Psychoneuroendocrinology. 2009;34(3):463–7. doi: 10.1016/j.psyneuen.2008.10.017. [DOI] [PubMed] [Google Scholar]
- 6.Ladd CO, Huot RL, Thrivikraman KV, Nemeroff CB, Meaney MJ, Plotsky PM. Long-term behavioral and neuroendocrine adaptations to adverse early experience. Prog Brain Res. 2000;122:81–103. doi: 10.1016/s0079-6123(08)62132-9. [DOI] [PubMed] [Google Scholar]
- 7.Levine S. Developmental determinants of sensitivity and resistance to stress. Psychoneuroendocrinology. 2005;30(10):939–46. doi: 10.1016/j.psyneuen.2005.03.013. [DOI] [PubMed] [Google Scholar]
- 8.Plotsky PM, Meaney MJ. Early, postnatal experience alters hypothalamic corticotropin-releasing factor (CRF) mRNA, median eminence CRF content and stress-induced release in adult rats, Brain research. Molecular brain research. 1993;18(3):195–200. doi: 10.1016/0169-328x(93)90189-v. [DOI] [PubMed] [Google Scholar]
- 9.Huot RL, Thrivikraman KV, Meaney MJ, Plotsky PM. Development of adult ethanol preference and anxiety as a consequence of neonatal maternal separation in Long Evans rats and reversal with antidepressant treatment. Psychopharmacology (Berl) 2001;158(4):366–73. doi: 10.1007/s002130100701. [DOI] [PubMed] [Google Scholar]
- 10.Leussis MP, Freund N, Brenhouse HC, Thompson BS, Andersen SL. Depressive-like behavior in adolescents after maternal separation: sex differences, controllability, and GABA. Dev Neurosci. 2012;34(2–3):210–7. doi: 10.1159/000339162. [DOI] [PMC free article] [PubMed] [Google Scholar]
- 11.Nishi M, Horii-Hayashi N, Sasagawa T. Effects of early life adverse experiences on the brain: implications from maternal separation models in rodents. Frontiers in neuroscience. 2014;8:166. doi: 10.3389/fnins.2014.00166. [DOI] [PMC free article] [PubMed] [Google Scholar]
- 12.Pryce CR, Ruedi-Bettschen D, Dettling AC, Weston A, Russig H, Ferger B, Feldon J. Long-term effects of early-life environmental manipulations in rodents and primates: Potential animal models in depression research. Neurosci Biobehav Rev. 2005;29(4–5):649–74. doi: 10.1016/j.neubiorev.2005.03.011. [DOI] [PubMed] [Google Scholar]
- 13.Thor DH, Holloway WR., Jr Social play in juvenile rats: a decade of methodological and experimental research. Neurosci Biobehav Rev. 1984;8(4):455–64. doi: 10.1016/0149-7634(84)90004-6. [DOI] [PubMed] [Google Scholar]
- 14.Vanderschuren LJ, Trezza V. What the laboratory rat has taught us about social play behavior: role in behavioral development and neural mechanisms. Curr Top Behav Neurosci. 2014;16:189–212. doi: 10.1007/7854_2013_268. [DOI] [PubMed] [Google Scholar]
- 15.Patterson-Kane EG, Hunt M, Harper D. Rats demand social contact. Animal Welfare. 2002;11(3):327–332. [Google Scholar]
- 16.Rutte C, Taborsky M. Generalized reciprocity in rats. PLoS Biol. 2007;5(7):e196. doi: 10.1371/journal.pbio.0050196. [DOI] [PMC free article] [PubMed] [Google Scholar]
- 17.Neumann ID. The advantage of social living: Brain neuropeptides mediate the beneficial consequences of sex and motherhood. Frontiers in Neuroendocrinology. 2009;30(4):483–496. doi: 10.1016/j.yfrne.2009.04.012. [DOI] [PubMed] [Google Scholar]
- 18.Wongwitdecha N, Marsden CA. Social isolation increases aggressive behaviour and alters the effects of diazepam in the rat social interaction test. Behav Brain Res. 1996;75(1–2):27–32. doi: 10.1016/0166-4328(96)00181-7. [DOI] [PubMed] [Google Scholar]
- 19.de Jong JG, van der Vegt BJ, Buwalda B, Koolhaas JM. Social environment determines the long-term effects of social defeat. Physiol Behav. 2005;84(1):87–95. doi: 10.1016/j.physbeh.2004.10.013. [DOI] [PubMed] [Google Scholar]
- 20.Liu X, Wu R, Tai F, Ma L, Wei B, Yang X, Zhang X, Jia R. Effects of group housing on stress induced emotional and neuroendocrine alterations. Brain research. 2013;1502:71–80. doi: 10.1016/j.brainres.2013.01.044. [DOI] [PubMed] [Google Scholar]
- 21.Serra M, Pisu MG, Floris I, Biggio G. Social isolation-induced changes in the hypothalamic-pituitary-adrenal axis in the rat. Stress. 2005;8(4):259–64. doi: 10.1080/10253890500495244. [DOI] [PubMed] [Google Scholar]
- 22.Toth M, Mikics E, Tulogdi A, Aliczki M, Haller J. Post-weaning social isolation induces abnormal forms of aggression in conjunction with increased glucocorticoid and autonomic stress responses. Horm Behav. 2011;60(1):28–36. doi: 10.1016/j.yhbeh.2011.02.003. [DOI] [PubMed] [Google Scholar]
- 23.Council NR. Guide for the Care and Use of Laboratory Animals. 8th. The National Academies Press; Washington, DC: 2011. [PubMed] [Google Scholar]
- 24.Bale TL, Davis AM, Auger AP, Dorsa DM, McCarthy MM. CNS region-specific oxytocin receptor expression: importance in regulation of anxiety and sex behavior. The Journal of neuroscience : the official journal of the Society for Neuroscience. 2001;21(7):2546–52. doi: 10.1523/JNEUROSCI.21-07-02546.2001. [DOI] [PMC free article] [PubMed] [Google Scholar]
- 25.Vaccari C, Lolait SJ, Ostrowski NL. Comparative distribution of vasopressin V1b and oxytocin receptor messenger ribonucleic acids in brain. Endocrinology. 1998;139(12):5015–33. doi: 10.1210/endo.139.12.6382. [DOI] [PubMed] [Google Scholar]
- 26.Yoshimura R, Kiyama H, Kimura T, Araki T, Maeno H, Tanizawa O, Tohyama M. Localization of oxytocin receptor messenger ribonucleic acid in the rat brain. Endocrinology. 1993;133(3):1239–46. doi: 10.1210/endo.133.3.8396014. [DOI] [PubMed] [Google Scholar]
- 27.Neumann ID. Brain oxytocin: a key regulator of emotional and social behaviours in both females and males. J Neuroendocrinol. 2008;20(6):858–65. doi: 10.1111/j.1365-2826.2008.01726.x. [DOI] [PubMed] [Google Scholar]
- 28.Ross HE, Young LJ. Oxytocin and the neural mechanisms regulating social cognition and affiliative behavior. Front Neuroendocrinol. 2009;30(4):534–47. doi: 10.1016/j.yfrne.2009.05.004. [DOI] [PMC free article] [PubMed] [Google Scholar]
- 29.Neumann ID, Wigger A, Torner L, Holsboer F, Landgraf R. Brain oxytocin inhibits basal and stress-induced activity of the hypothalamo-pituitary-adrenal axis in male and female rats: partial action within the paraventricular nucleus. J Neuroendocrinol. 2000;12(3):235–43. doi: 10.1046/j.1365-2826.2000.00442.x. [DOI] [PubMed] [Google Scholar]
- 30.Legros JJ. Inhibitory effect of oxytocin on corticotrope function in humans: are vasopressin and oxytocin ying-yang neurohormones? Psychoneuroendocrinology. 2001;26(7):649–55. doi: 10.1016/s0306-4530(01)00018-x. [DOI] [PubMed] [Google Scholar]
- 31.Arletti R, Bertolini A. Oxytocin acts as an antidepressant in two animal models of depression. Life sciences. 1987;41(14):1725–30. doi: 10.1016/0024-3205(87)90600-x. [DOI] [PubMed] [Google Scholar]
- 32.Matsuzaki M, Matsushita H, Tomizawa K, Matsui H. Oxytocin: a therapeutic target for mental disorders. J Physiol Sci. 2012;62(6):441–4. doi: 10.1007/s12576-012-0232-9. [DOI] [PMC free article] [PubMed] [Google Scholar]
- 33.Neumann ID, Landgraf R. Balance of brain oxytocin and vasopressin: implications for anxiety, depression, and social behaviors. Trends Neurosci. 2012;35(11):649–59. doi: 10.1016/j.tins.2012.08.004. [DOI] [PubMed] [Google Scholar]
- 34.Grady MM, Stahl SM. Novel agents in development for the treatment of depression. CNS Spectr. 2013;18(Suppl 1):37–40. doi: 10.1017/S1092852913000758. quiz 41. [DOI] [PubMed] [Google Scholar]
- 35.Gupta D, Radhakrishnan M, Bhatt S, Kurhe Y. Role of Hypothalamic-pituitary-adrenal-axis in Affective Disorders: Anti-depressant and Anxiolytic Activity of Partial 5-HT1A Agonist in Adrenalectomised Rats. Indian J Psychol Med. 2013;35(3):290–8. doi: 10.4103/0253-7176.119501. [DOI] [PMC free article] [PubMed] [Google Scholar]
- 36.Reus VI. Toward an understanding of cortisol dysregulation in major depression: a review of studies of the dexamethasone suppression test and urinary free-cortisol. Psychiatr Med. 1985;3(1):1–21. [PubMed] [Google Scholar]
- 37.Detke MJ, Rickels M, Lucki I. Active behaviors in the rat forced swimming test differentially produced by serotonergic and noradrenergic antidepressants. Psychopharmacology (Berl) 1995;121(1):66–72. doi: 10.1007/BF02245592. [DOI] [PubMed] [Google Scholar]
- 38.Savignac HM, Dinan TG, Cryan JF. Resistance to early-life stress in mice: effects of genetic background and stress duration. Front Behav Neurosci. 2011;5:13. doi: 10.3389/fnbeh.2011.00013. [DOI] [PMC free article] [PubMed] [Google Scholar]
- 39.Hurley LL, Akinfiresoye L, Kalejaiye O, Tizabi Y. Antidepressant effects of resveratrol in an animal model of depression. Behav Brain Res. 2014;268:1–7. doi: 10.1016/j.bbr.2014.03.052. [DOI] [PMC free article] [PubMed] [Google Scholar]
- 40.Kalejaiye O, Bhatti BH, Taylor RE, Tizabi Y. Nicotine Blocks the Depressogenic Effects of Alcohol: Implications for Drinking-Smoking Co-Morbidity. J Drug Alcohol Res. 2013;2:235709. doi: 10.4303/jdar/235709. [DOI] [PMC free article] [PubMed] [Google Scholar]
- 41.Polston EK, Gu G, Simerly RB. Neurons in the principal nucleus of the bed nuclei of the stria terminalis provide a sexually dimorphic GABAergic input to the anteroventral periventricular nucleus of the hypothalamus. Neuroscience. 2004;123(3):793–803. doi: 10.1016/j.neuroscience.2003.09.034. [DOI] [PubMed] [Google Scholar]
- 42.Swanson LW. Brain Maps: Structure of the Rat Brain. Elsevier Academic Press; Los Angeles, CA: 2004. Third Revised Edition ed. [Google Scholar]
- 43.Patisaul HB, Fortino AE, Polston EK. Differential disruption of nuclear volume and neuronal phenotype in the preoptic area by neonatal exposure to genistein and bisphenol-A. Neurotoxicology. 2007;28(1):1–12. doi: 10.1016/j.neuro.2006.10.001. [DOI] [PubMed] [Google Scholar]
- 44.Swanson LW, Sawchenko PE. Hypothalamic integration: organization of the paraventricular and supraoptic nuclei. Annu Rev Neurosci. 1983;6:269–324. doi: 10.1146/annurev.ne.06.030183.001413. [DOI] [PubMed] [Google Scholar]
- 45.Gundersen HJ, Bagger P, Bendtsen TF, Evans SM, Korbo L, Marcussen N, Moller A, Nielsen K, Nyengaard JR, Pakkenberg B, et al. The new stereological tools: disector, fractionator, nucleator and point sampled intercepts and their use in pathological research and diagnosis. APMIS : acta pathologica, microbiologica, et immunologica Scandinavica. 1988;96(10):857–81. doi: 10.1111/j.1699-0463.1988.tb00954.x. [DOI] [PubMed] [Google Scholar]
- 46.Francis DD, Diorio J, Plotsky PM, Meaney MJ. Environmental enrichment reverses the effects of maternal separation on stress reactivity. The Journal of neuroscience : the official journal of the Society for Neuroscience. 2002;22(18):7840–3. doi: 10.1523/JNEUROSCI.22-18-07840.2002. [DOI] [PMC free article] [PubMed] [Google Scholar]
- 47.Paul MJ, Terranova JI, Probst CK, Murray EK, Ismail NI, de Vries GJ. Sexually dimorphic role for vasopressin in the development of social play. Front Behav Neurosci. 2014;8:58. doi: 10.3389/fnbeh.2014.00058. [DOI] [PMC free article] [PubMed] [Google Scholar]
- 48.Altemus M, Sarvaiya N, Neill Epperson C. Sex differences in anxiety and depression clinical perspectives. Front Neuroendocrinol. 2014;35(3):320–30. doi: 10.1016/j.yfrne.2014.05.004. [DOI] [PMC free article] [PubMed] [Google Scholar]
- 49.Hong S, Flashner B, Chiu M, ver Hoeve E, Luz S, Bhatnagar S. Social isolation in adolescence alters behaviors in the forced swim and sucrose preference tests in female but not in male rats. Physiol Behav. 2012;105(2):269–75. doi: 10.1016/j.physbeh.2011.08.036. [DOI] [PMC free article] [PubMed] [Google Scholar]
- 50.Kessler RC, Bromet EJ. The epidemiology of depression across cultures. Annu Rev Public Health. 2013;34:119–38. doi: 10.1146/annurev-publhealth-031912-114409. [DOI] [PMC free article] [PubMed] [Google Scholar]
- 51.Ter Horst GJ, Wichmann R, Gerrits M, Westenbroek C, Lin Y. Sex differences in stress responses: focus on ovarian hormones. Physiol Behav. 2009;97(2):239–49. doi: 10.1016/j.physbeh.2009.02.036. [DOI] [PubMed] [Google Scholar]
- 52.Veenema AH, Blume A, Niederle D, Buwalda B, Neumann ID. Effects of early life stress on adult male aggression and hypothalamic vasopressin and serotonin. Eur J Neurosci. 2006;24(6):1711–20. doi: 10.1111/j.1460-9568.2006.05045.x. [DOI] [PubMed] [Google Scholar]
- 53.Tsuda MC, Yamaguchi N, Ogawa S. Early life stress disrupts peripubertal development of aggression in male mice. Neuroreport. 2011;22(6):259–63. doi: 10.1097/WNR.0b013e328344495a. [DOI] [PubMed] [Google Scholar]
- 54.Veenema AH, Bredewold R, Neumann ID. Opposite effects of maternal separation on intermale and maternal aggression in C57BL/6 mice: link to hypothalamic vasopressin and oxytocin immunoreactivity. Psychoneuroendocrinology. 2007;32(5):437–50. doi: 10.1016/j.psyneuen.2007.02.008. [DOI] [PubMed] [Google Scholar]
- 55.Lehmann J, Feldon J. Long-term biobehavioral effects of maternal separation in the rat: consistent or confusing? Reviews in the neurosciences. 2000;11(4):383–408. doi: 10.1515/revneuro.2000.11.4.383. [DOI] [PubMed] [Google Scholar]
- 56.Ogawa T, Kuwagata M, Hori Y, Shioda S. Valproate-induced developmental neurotoxicity is affected by maternal conditions including shipping stress and environmental change during early pregnancy. Toxicol Lett. 2007;174(1–3):18–24. doi: 10.1016/j.toxlet.2007.08.006. [DOI] [PubMed] [Google Scholar]
- 57.Stewart J, Kolb B. The effects of neonatal gonadectomy and prenatal stress on cortical thickness and asymmetry in rats. Behav Neural Biol. 1988;49(3):344–60. doi: 10.1016/s0163-1047(88)90354-8. [DOI] [PubMed] [Google Scholar]
- 58.Mueller BR, Bale TL. Sex-specific programming of offspring emotionality after stress early in pregnancy. The Journal of neuroscience : the official journal of the Society for Neuroscience. 2008;28(36):9055–65. doi: 10.1523/JNEUROSCI.1424-08.2008. [DOI] [PMC free article] [PubMed] [Google Scholar]
- 59.Todeschin AS, Winkelmann-Duarte EC, Jacob MH, Aranda BC, Jacobs S, Fernandes MC, Ribeiro MF, Sanvitto GL, Lucion AB. Effects of neonatal handling on social memory, social interaction, and number of oxytocin and vasopressin neurons in rats. Horm Behav. 2009;56(1):93–100. doi: 10.1016/j.yhbeh.2009.03.006. [DOI] [PubMed] [Google Scholar]
- 60.Veenema AH. Toward understanding how early-life social experiences alter oxytocin- and vasopressin-regulated social behaviors. Horm Behav. 2012;61(3):304–12. doi: 10.1016/j.yhbeh.2011.12.002. [DOI] [PubMed] [Google Scholar]
- 61.Gundersen HJ, Osterby R. Optimizing sampling efficiency of stereological studies in biology: or ‘do more less well!’. J Microsc. 1981;121(Pt 1):65–73. doi: 10.1111/j.1365-2818.1981.tb01199.x. [DOI] [PubMed] [Google Scholar]
- 62.Manaye KF, Lei DL, Tizabi Y, Davila-Garcia MI, Mouton PR, Kelly PH. Selective neuron loss in the paraventricular nucleus of hypothalamus in patients suffering from major depression and bipolar disorder. J Neuropathol Exp Neurol. 2005;64(3):224–9. doi: 10.1093/jnen/64.3.224. [DOI] [PubMed] [Google Scholar]