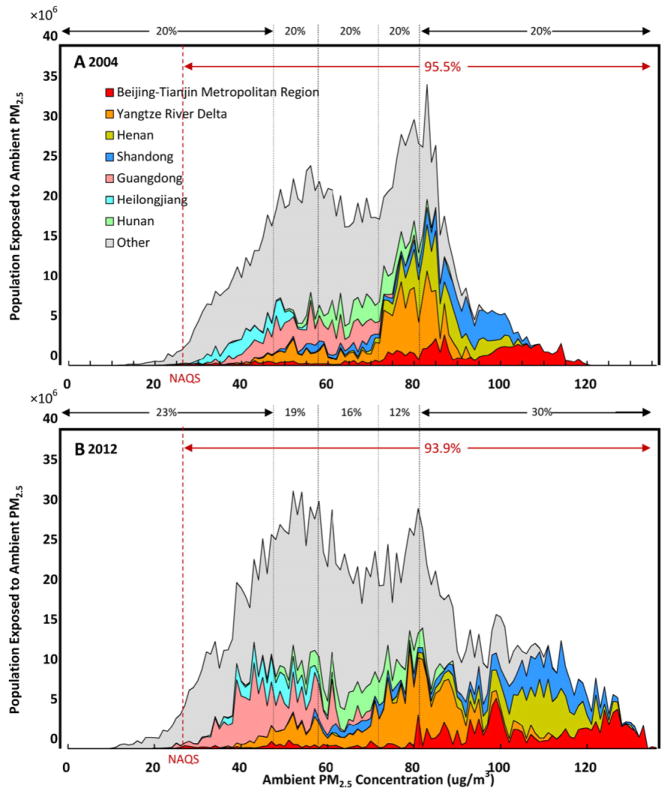
Fig. 1.
National and provincial distribution of population as a function of ambient PM2.5 concentration in 2004 (A) and 2012 (B). Red dash vertical lines (in both plots) indicate the annual concentration limits in China’s National Air Quality Standard for GradeII. Grey dash vertical lines (in both plots) demarcate boundaries of population quintiles that apportion the PM2.5 concentration distribution into 5 bins with equal number of exposed population in 2004.

