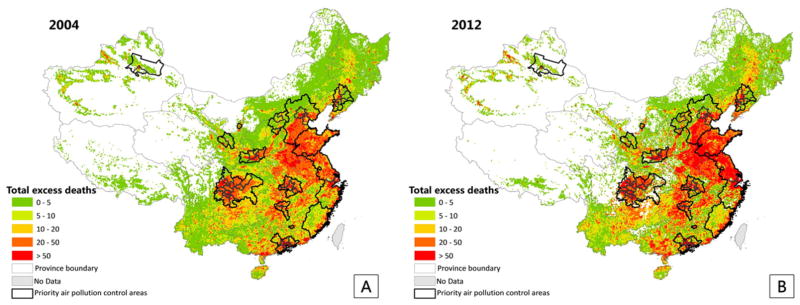
Fig. 3.
Spatial distributions of total excess deaths attributable to PM2.5 exposure in 2004 (A) and 2012 (B) (cases per 100 km2). Total deaths here are the sum of deaths caused by lung cancer, IHD and stroke. Black lines show the boundary of priority areas of national joint air pollution prevention and control.

