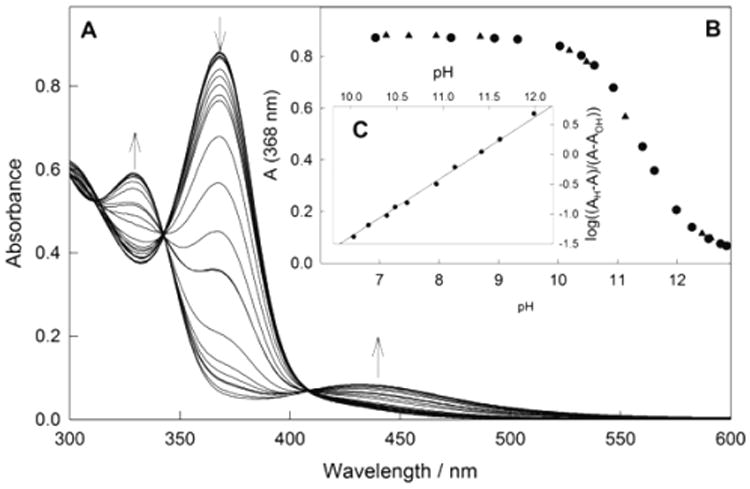
Figure 2.

(A) Spectral changes of 4 at pH 7–13. Circles and triangles are the data obtained by changing the pH from 7 to 13 and from 13 to 7, respectively. (B) Absorbance (368 nm) vs pH. (C) Linearization of the data using eq 2. Conditions: 1.2 × 10⁻⁴ M 4, 25 °C, Carmody buffer.
