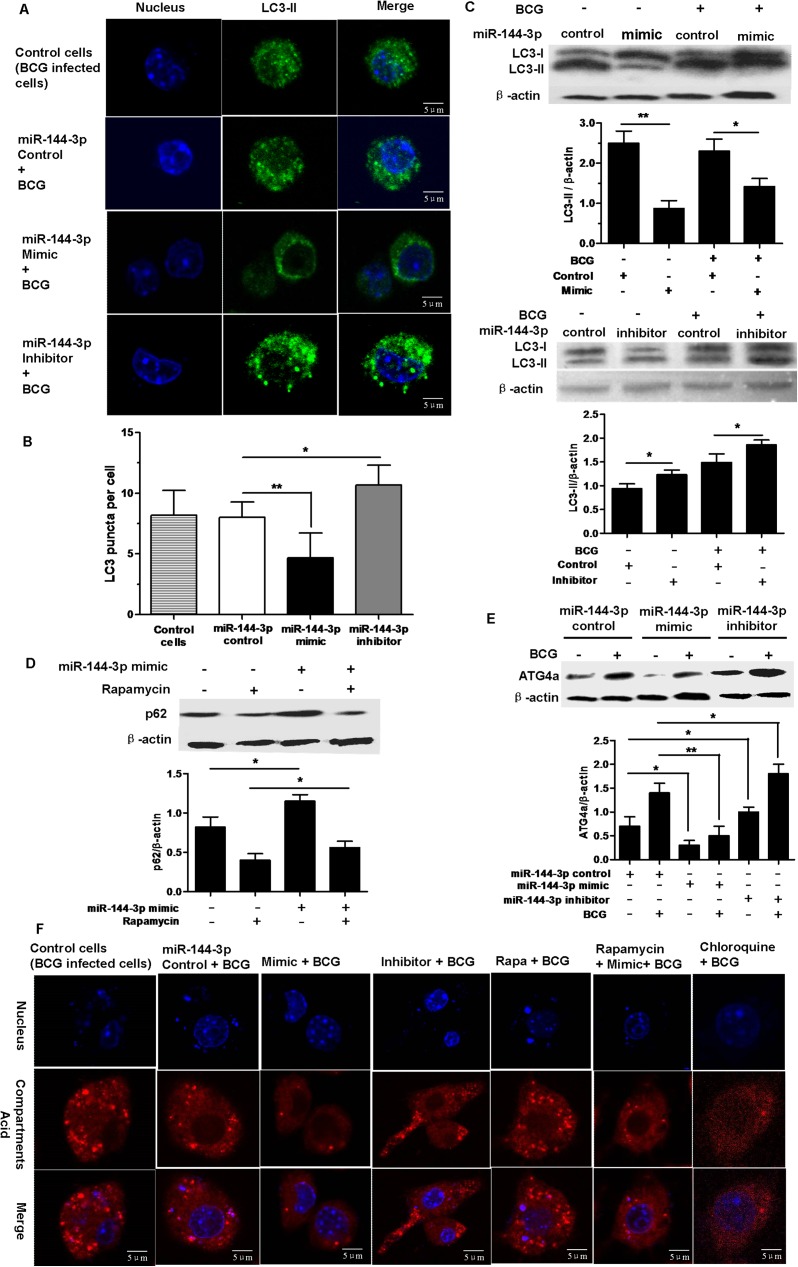
Fig 3. miR-144-3p inhibits autophagy in RAW264.7 cells.
(A and B) RAW264.7 cells were transfected with miR-144-3p control, miR-144-3p mimic or inhibitor, and then infected with BCG for 24 h. The cells were incubated with a rabbit anti-LC3 Ab, followed by detection using Alexa Fluor 488–conjugated goat anti-rabbit IgG and DAPI. The formation of LC3 puncta was then detected by confocal microscopy. Scale bar = 5 μm. The control cells are BCG-infected cells without transfection with any types of miRNAs. LC3 puncta were determined using ImageJ software (miR-144-3p control, n = 15 cells; miR-144-3p mimic, n = 15 cells; miR-144-3p inhibitor, n = 15 cells). Data represent the means ± SD from three independent experiments. *p < 0.05, **p < 0.01. (C) RAW264.7 cells were transfected with an miR-144-3p mimic or inhibitor and then infected with BCG for 24 h. 30 μg of total cell extracts were analyzed by Western blotting with a rabbit anti-LC3 antibody. The conversion of LC3-I to LC3-II was determined by Western blot analysis (upper). The quantitative analysis of LC3-II protein levels, normalized to β-actin expression, are shown (lower). Data are shown as mean ± SD of three independent experiments. *, p <0.05; **, p<0.01. (D) RAW264.7 cells transfected with miR-144-3p control or miR-144-3p mimic in full medium with or without 50μg/ml rapamycin or 0.1% DMSO. 50 μg of total cell extracts were analyzed by Western blotting with a mouse anti-SQSTM1/p62 antibody. The p62 levels were detected by Western-blot (upper). Quantitative analysis of the p62 band normalized to β-actin is shown (lower). Data are shown as mean ± SD of four independent experiments. *, p <0.05. (E) RAW264.7 cells were transfected with miR-144-3p control, miR-144-3p mimic or inhibitor and then infected with BCG. 50 μg of total cell extracts were analyzed by Western blotting with a rabbit anti-ATG4a antibody. Representative Western blot image for ATG4a expression (upper) and quantitative analysis of ATG4a protein levels, normalized to β-actin expression (lower), are shown. Data are shown as mean ± SD of three independent experiments. *, p <0.05; **, p<0.01. (F) miR-144-3p inhibited autolysosome formation. RAW264.7 cells were transiently transfected with miR-144-3p control, miR-144-3p mimic or inhibitor, or were treated with rapamycin, chloroquine, or rapamycin plus miR-144-3p mimic. Then RAW264.7 cells were infected with BCG for 24 h. After that the RAW264.7 cells were incubated with a specific fluorescent dye Lyso tracker RED (50 nM). The control cells are BCG-infected cells without transfection with any types of miRNAs. The positive acid compartments were detected by confocal microscopy. Scale bar = 5 μm.

