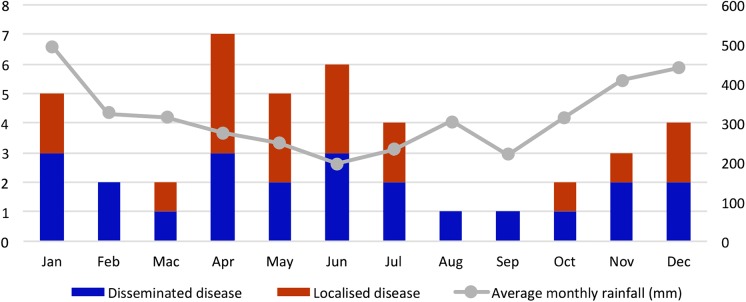
Fig 2. Distribution of the 42 pediatric melioidosis cases and average rainfall by month.
The bar chart shows the distribution of the 42 pediatric melioidosis cases according to the month of admission. The average monthly rainfall over the 6-year period (January 2009—December 2014) in Central Sarawak is shown in the line graph. Cases are categorized into disseminated and localized melioidosis.

