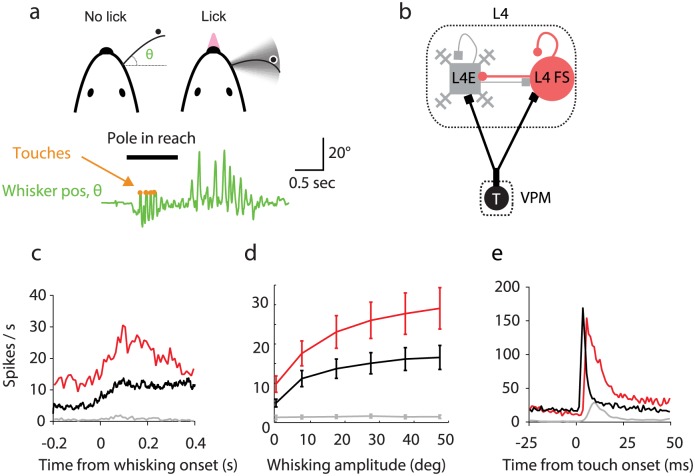
Fig 1. Summary of experimental results in the object-localization task [37].
(a) Top, schematic illustrates measurement of whisker position (azimuthal angle θ), instances of touch and an example trace of whisker position. Protraction corresponds to positive changes in θ. (b) Schematics of the thalamocortical circuit and relevant cell-types. (c) Spike rate aligned to transitions from non-whisking to whisking (adapted from panel 5e in [37]). (d) Average spike rate as a function of whisking amplitude. (e) Average population response aligned to touch (adapted from panel 5c in [37]). Data and figures corresponding to previously reported datasets [36, 37].

