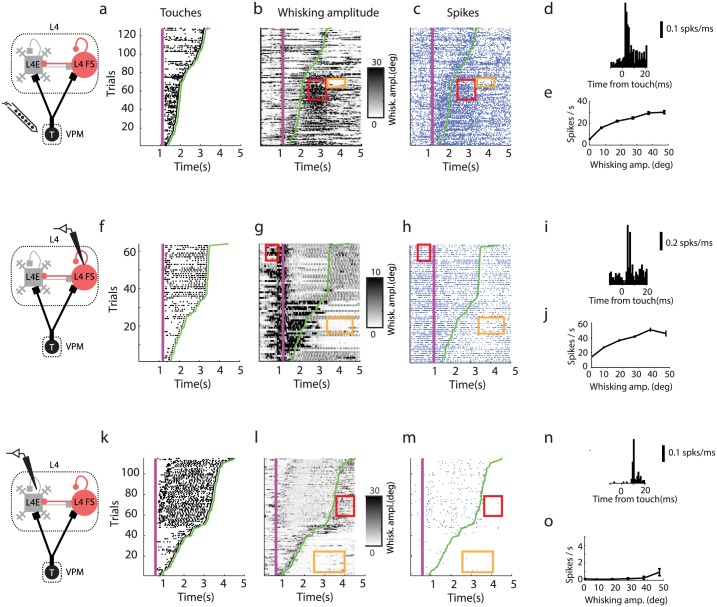
Fig 3. Example neurons across the thalamocortical circuit.
(a) Touch raster (black dots; sorted by last touch in a trial). The magenta line shows when the pole was moved within reach of the whiskers. The green line represents the last touch in each trial. (b) Whisker movement amplitude. Red rectangle, epoch of high whisker movement amplitude and high spike rate. Orange rectangle, epoch of low amplitude and low spike rate. (c) Spike raster of an example neuron in VPM (blue dots, spikes). Red and orange regions of interest correspond to B. (d) PSTH showing response for touch. (e) Spike rate as a function of whisker movement amplitude. (f-j) Same as a-e for a L4 FS neuron. (k-o) Same as a-f for a L4 excitatory neuron. The few spikes that occur during whisking are phase-locked to movement.

