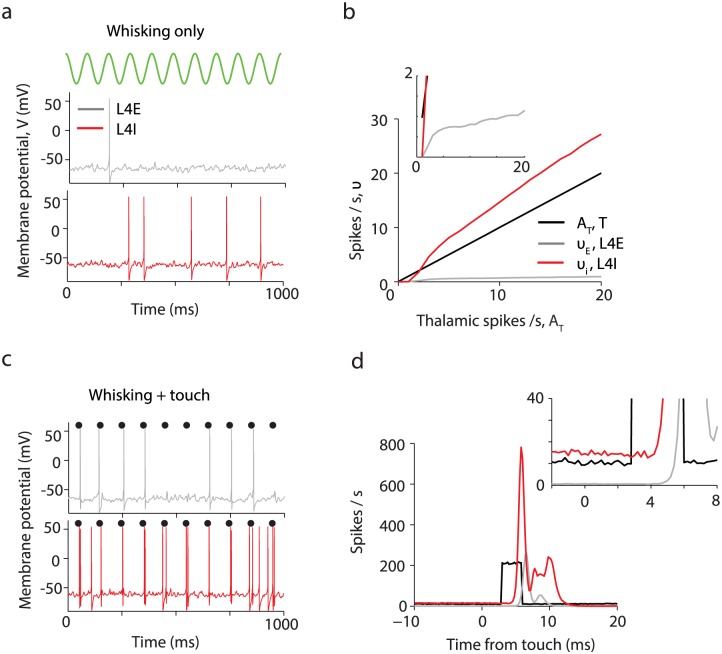
Fig 6. A neural network model of L4 explains suppression of whisker movement signals in L4 excitatory neurons.
The colors black, grey and red denote T, L4E and L4I neuronal populations respectively. (a) Example L4E and L4I membrane potential during simulated whisking (green). (b) The population- and time average spike rates νE and νI of the L4E and L4I neurons respectively as function of the thalamic input AT in the absence of touch. L4I neurons follow linearly the thalamic input while L4E neurons increase only weakly with AT beyond firing threshold. Inset, zoom in. (c) Membrane potential for an example neuron during whisking and touch (black dots). (d) Population PSTH aligned to touch onset. Inset, zoom in.

