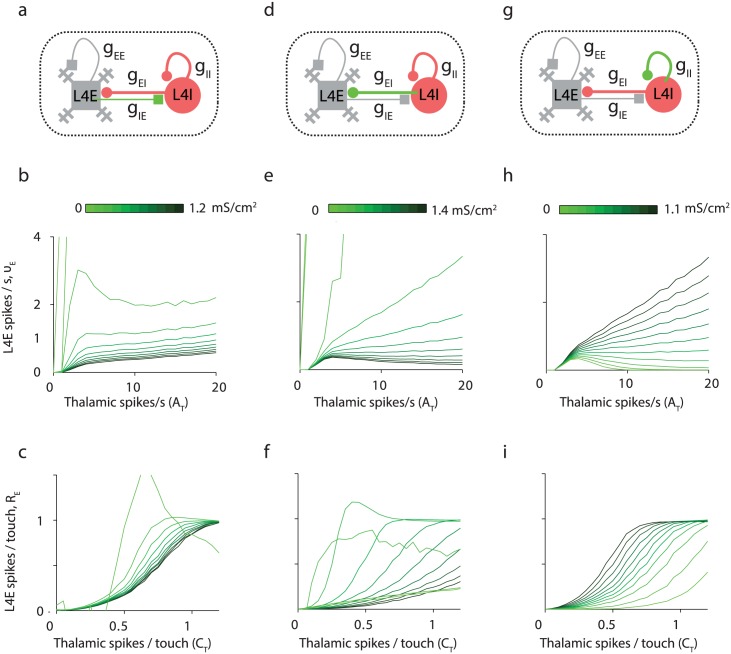
Fig 9. Inhibition in L4 controls the response to L4E neurons.
(a-c) Changing gIE from 0 to 1.2 mS/cm2 (d-f) Changing gEI from 0 to 1.4 mS/cm2. (g-i) Changing gII from 0 to 1.1 mS/cm2. In the top panels, the synaptic connection that its strength is varied is plotted in green. In the middle and bottom panels, curves are plotted for 11 values of the relevant g from 0 (light green) to its maximal value, that is twice the reference parameter value (dark green). (b, e, h) The response of L4E neurons, νE, to slowly varying thalamic input, which correlates with the amplitude of whisking. (c, f, i) The response of L4E neurons to spikes, RE, associated with touch.

