
Figure 3.
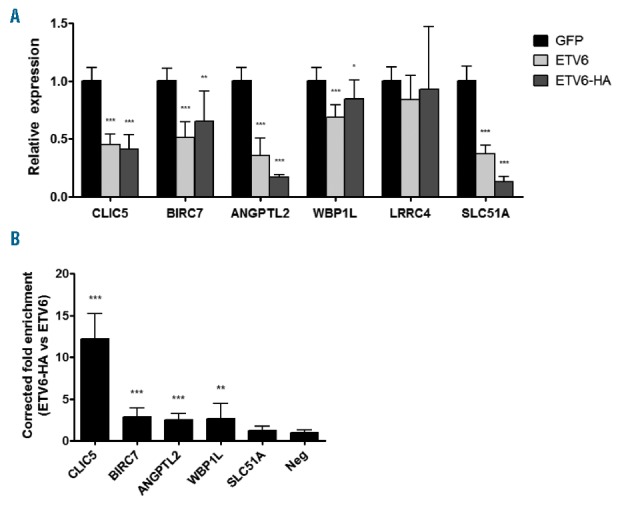
Quantitative real-time PCR and chromatin immunoprecipitation validation of putative ETV6 target genes. Reh cells together with the two Reh derivated clones were infected with pCCL GFP, ETV6 WT or ETV6-HA. (A) Total RNA was extracted from these cells and complementary DNA was generated. This cDNA was submitted to qRT-PCR (quantitative real time PCR) analysis to quantify relative expression of putative ETV6 targets. Expression of all genes but LRRC4 is repressed by ETV6 WT (wild-type) and ETV6-HA. (B) ChIP (chromatin immunoprecipitation) experiments were performed in ETV6-WT and ETV6-HA cells. Putative ETV6 target gene proximal promoter enrichment was determined by qRT-PCR using promoter-specific primers. Results are presented as the ratio of the input percentage obtained in ETV6-HA cells compared to ETV6 WT cells, corrected by the background enrichment obtained with an unbound region (Neg). CLIC5, BIRC7, ANGPTL2 and WBP1L promoters are enriched. For both qRT-PCR and ChIP experiments, 4 values were calculated for each of the 3 cell lines and were merged for a total of 12 values (n=12). Error bars represent the standard deviation. Statistical significance is calculated by two-tailed and one-tailed Mann-Whitney U test for qRT-PCR and ChIP analysis, respectively.