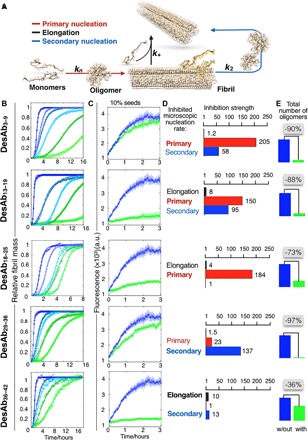
Fig. 3. The antibody scanning method produces antibodies that affect different microscopic steps in Aβ42 aggregation.

(A) Model of aggregation of Aβ42 showing the primary (red arrow) and the secondary (blue arrow) nucleation of the oligomers and the elongation of the fibrils (black arrow). (B) Solutions containing 2 μM Aβ42 were incubated in the presence of increasing (blue to green) Aβ42 monomer equivalents of the DesAbs (serial dilutions starting from 1 μM DesAb concentration; see fig. S5); each antibody targets a specific epitope within the sequence of Aβ42 (Fig. 1) and inhibits the aggregation of the peptide in a characteristic manner. Continuous lines represent the fits of the data using the integrated rate law for Aβ42 aggregation (see Materials and Methods). (C) Seeded aggregation of Aβ42 in the presence of 10% preformed fibrils with a 0:1 (blue) or 1:1 (green) antibody–to–Aβ42 monomer ratio. a.u., arbitrary units. (D) Bar plot showing the inhibition strength of the DesAbs (which is defined as kAβ42/kAβ42+DesAb) on k+ (black), kn (red), and k2 (blue) rate constants, derived from (B), (C), and fig. S5. The fold change in the presence of the antibodies of each of the rate constants is indicated on the top of the corresponding bar. (E) Relative number of oligomers generated during the aggregation reaction with or without a 1:2 antibody–to–Aβ42 monomer ratio.
