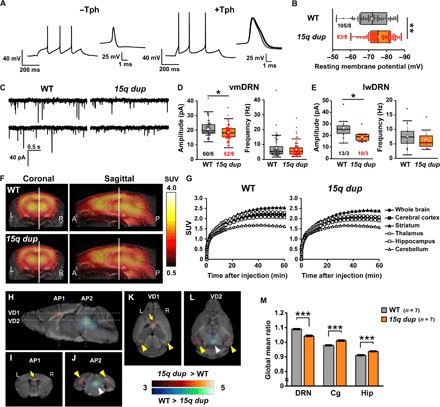
Fig. 1. 15q dup mice have reduced excitatory synaptic transmission onto 5-HT neurons and low glucose metabolism in the DRN.

(A) Representative action potential recordings of non–5-HT (Tph-immunoreactive–negative, −Tph) and 5-HT (Tph-immunoreactive–positive, +Tph) neurons in DRN in response to depolarizing current injections of 100 and 140 pA, respectively (left). Individual spikes are aligned at the starting point of spike and displayed in an expanded time scale (right). (B) The resting membrane potentials of 5-HT neurons in the DRN were hyperpolarized in 15q dup mice. **P < 0.01, Wilcoxon rank sum test. (C) Representative sEPSC traces recorded from 5-HT neurons in DRN. (D and E) Comparisons between WT and 15q dup mice for the sEPSC amplitude and frequency in 5-HT neurons obtained from the vmDRN and lwDRN subregions. The amplitude but not the frequency of sEPSCs was decreased in 15q dup mice at vmDRN (*P < 0.05, Brunner-Munzel test) and lwDRN (*P < 0.05, Wilcoxon rank sum test). n = cells per mice. (F) Summed PET images from 30 to 60 min after the [18F]FDG injection were made by averaging the images in each group (n = 7 mice, triplicate in each genotype). The heat map indicates the standardized uptake value (SUV) of glucose. (G) The graphs show the mean time–radioactivity curves of [18F]FDG. Regions of interest were manually drawn on the [18F]FDG-PET images based on a morphologically normalized coronal magnetic resonance T1-weighted image. (H) Maps of the t scores obtained by voxel-based statistical comparisons of the [18F]FDG uptake between WT and 15q dup mice. An unpaired two-sample t test was performed. Pseudocolor maps of the t scores are fused on a mouse brain magnetic resonance T1-weighted image. (I to L) The coronal sections correspond to AP1 and AP2 dashed lines in (H) [(I) and (J)], and the horizontal sections correspond to VD1 and VD2 dashed lines in (H) [(K) and (L)]. Low glucose metabolism in the DRN (white arrowheads) of 15q dup mice was observed compared with that in WT littermates. The 15q dup mice also showed high glucose metabolism in the anterior cingulate cortex (Cg; yellow arrows) and hippocampal region (Hip; yellow arrowheads). Statistical significance was defined at a threshold of P < 0.005 (uncorrected), t > 3.05, F = 12. (M) Differences in [18F]FDG uptake ratios (calculated as regional uptake per whole brain uptake of [18F]FDG) between the two groups (n = 7 mice in each group; ***P < 0.001, two-tailed Student’s t test). Box plots represent the median and the 25th and 75th percentiles. Each dot represents individual sample data. The mean is represented by a plus sign. Whiskers represent the minimum and maximum values except for outliers. All other values are means ± SEM.
