
Fig. 2. Sensory-evoked somatosensory receptive field tuning responses are impaired in 15q dup mice.
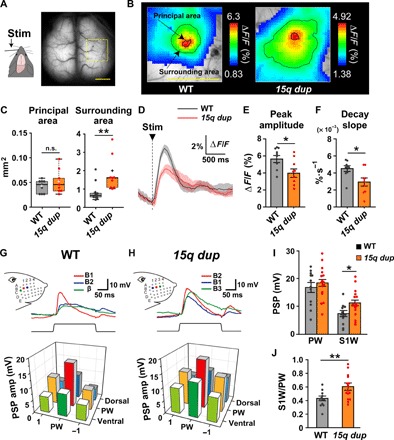
(A) The right barrel field (yellow open square) was analyzed in the transcranial calcium imaging. The left C2 whisker is stimulated by a piezo driver at 10 Hz of 10 pulses and at 0.25 Hz of 20 pulses. Scale bar, 2 mm. (B) Representative images of barrel area responses at 10-Hz stimulation in each genotype. The color represents the ΔF/F of averaged image. The area within the bold line indicates the response in principal barrel, and the area within the fine line indicates the response in surrounding barrels of the C2 whisker barrel. Scale bar, 2 mm. (C) The area size of the principal barrel was comparable between genotypes, whereas the area size of the surrounding barrel was larger in 15q dup mice. **P < 0.01, Wilcoxon rank sum test. n.s., not significant. (D) The traces indicate the averaged ΔF/F of the principal barrel (black, WT; red, 15q dup) at 0.25-Hz stimulation. The faint color indicates SEMs in each genotype. (E) The peak amplitude of the principal barrel was smaller in 15q dup mice. (F) The decay slope of the principal barrel was smaller in 15q dup mice. *P < 0.05, two-tailed Student’s t test. n = 9 mice in both genotypes. (G and H) Top: Superimposed traces show the averaged responses to single whisker deflections of the PW, which has the strongest amplitude and fastest onset latency to the whisker stimuli (red, B1), and the S1Ws, which have weaker amplitudes and slower onset latencies (blue, B2; green, β), in a representative case of WT mice and those to the PW (red, B2) and the S1Ws (blue, B1; green, B3) in a representative case of 15q dup mice. Insets: Schema indicates the whisker pattern and deflection points. Bottom: Three-dimensional bar graphs show receptive field maps of averaged postsynaptic potential (PSP) amplitudes, centered to the PW. The PSPs of S1Ws in 15q dup mice showed higher responses than those in WT mice. (I) The PSP amplitude of the PW was normal, but that of S1W was increased in 15q dup mice. (J) The ratio of S1W- to PW-PSP amplitudes was increased in 15q dup mice. WT, n = 12 mice; 15q dup, n = 16 mice. *P < 0.05; **P < 0.01, two-tailed Student’s t test. Box plots represent the median and the 25th and 75th percentiles. Each dot represents individual sample data. The mean is represented by a plus sign. Whiskers represent the minimum and maximum values except for outliers. All other values are means ± SEM.