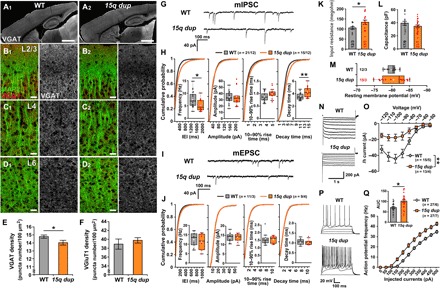
Fig. 3. 15q dup mice have fewer inhibitory synapses and a higher excitability of pyramidal neurons in L2/3 of somatosensory cortex.

(A to D) Representative images show the S1BF with anti–microtubule-associated protein 2 (MAP2) and anti-VGAT immunostaining [A1 to D1 (left column), WT; A2 to D2 (right column), 15q dup]. At low magnification, VGAT signals (white) are comparable between WT (A1) and 15q dup (A2) mice. Scale bars, 1 mm. At high magnification, inhibitory terminals (red, VGAT) on neural dendrites (green, MAP2) in L2/3, L4, and L6 of the S1BF show that only in L2/3 were the VGAT signals weaker in 15q dup mice (B2) than in WT mice (B1). The VGAT signals in L4 (C1 and C2) and L6 (D1 and D2) were comparable. Scale bars, 20 μm. (E) The density of VGAT-positive puncta is reduced in L2/3 of 15q dup mice (*P < 0.05, two-tailed Student’s t test; n = 15 images from five mice per genotype). (F) The density of VGluT1-positve puncta was not changed in L2/3 of 15q dup mice. (G) Representative traces of mIPSCs from L2/3 pyramidal neurons in the S1BF of WT and 15q dup mice. (H) The graphs show box plots and cumulative probabilities for mIPSC frequency and basic synaptic responses (amplitude, 10 to 90% rise time, and decay time constant). In 15q dup mice, the mIPSC frequency was decreased (*P < 0.05, two-tailed Student’s t test), and the cumulative probability of the inter-event interval (IEI) was shifted to the right compared to WT mice. The amplitude and rise time were not changed, but the decay time was increased in 15q dup mice (**P < 0.01, two-tailed Welch’s t test). (I) Representative traces of mEPSCs from L2/3 pyramidal neurons in the S1BF of WT and 15q dup mice. (J) The graphs show box plots and cumulative probabilities for mEPSCs frequencies and basic synaptic responses. There was no difference between genotypes. (K to M) The graphs show the intrinsic properties of L2/3 pyramidal neurons. The input resistance calculated from the voltage trace in response to the hyperpolarizing current of −50 pA was higher in 15q dup neurons (K), whereas the cellular capacitance (L) and the resting membrane potential (M) were unchanged. *P < 0.05, two-tailed Welch’s t test. (N) Representative traces of the Ih current recorded by the hyperpolarizing voltage steps from −50 to −120 mV. The Ih currents were calculated by dividing the instantaneous current measured at the beginning of the negative voltage step by the steady-state current at the end of the step. (O) The Ih currents were smaller in 15q dup neurons [genotype: F1,26 = 9.495, **P < 0.01, two-way repeated-measures analysis of variance (ANOVA)]. (P) The representative voltage traces of L2/3 pyramidal neurons of WT and 15q dup S1BF in response to current injections with amplitudes from 0 to 400 pA with 100-pA steps. (Q) The action potential frequencies are plotted against amplitudes of depolarizing currents. Inset: The area under the curve (AUC) in the line graph was larger in 15q dup mice (*P < 0.05, two-tailed Welch’s t test). n = cells per mice. Box plots represent the median and the 25th and 75th percentiles. Each dot represents individual sample data. The mean is represented by a plus sign. Whiskers represent the minimum and maximum values except for outliers. All other values are means ± SEM.
