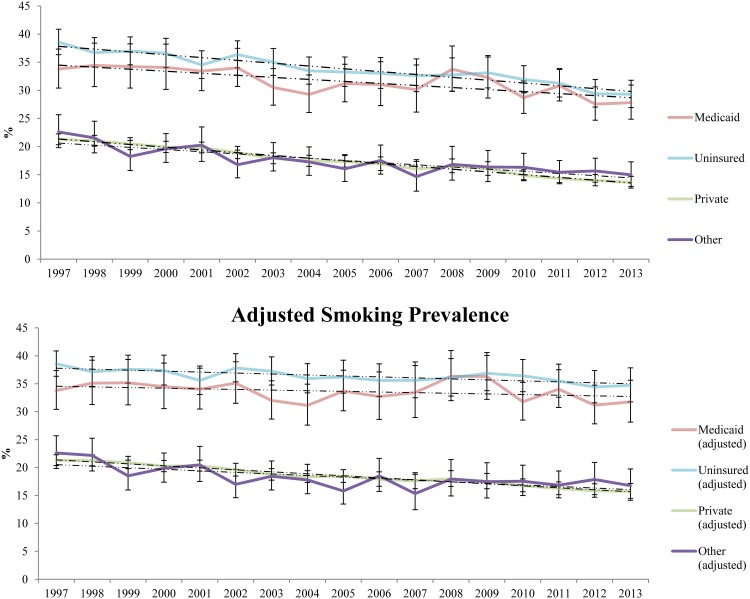
Fig 2. Smoking prevalence of US adults by insurance coverage.
The top panel: Error bars represent the 99.7% confidence intervals, used to adjust for multiple comparisons (retaining an overall 95% family-wise error for the 17 surveys from 1997 to 2013). The bottom panel: Error bars represent the 99.7% confidence intervals, used to adjust for multiple comparisons (retaining an overall 95% family-wise error rate for the 17 surveys from 1997 to 2013). Data from the 1998 and the later surveys were also re-weighted to the demographic composition (i.e. gender, age, education, race/ethnicity) of the 1997 survey.

