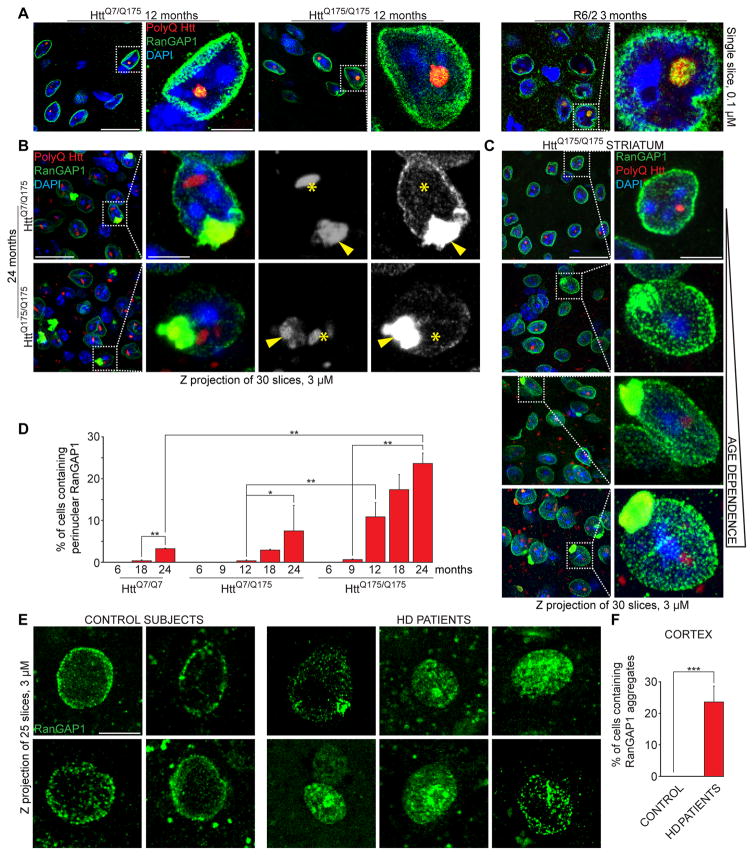
Figure 4. Expanded polyQ Huntingtin sequesters RanGAP1.
(A) Immunofluorescence (IF) of RanGAP1 (green) and polyQ Htt (red) in cortical sections of mice of indicated genotypes and ages. Arrowheads point to RanGap1/polyQ Htt nuclear co-localization. Single slices (0.1 μM) are shown. (B) IF of RanGAP1 (green) and polyQ Htt (red) in cortex of 24-month old mice of indicated genotypes. Localization of nuclear (asterisks) and perinuclear (arrowheads) polyQ Htt aggregates is shown. (C) IF of RanGAP1 in striatal sections of HttQ175/Q175 mice of indicated ages. (D) Percentage of cells containing perinuclear RanGAP1 in cortical sections of mice of indicated genotypes and ages. At least 600 cells per animal were analyzed. (E, F) IF of RanGAP1 (E) and percentage of cells containing mislocalized RanGAP1 (F) in sections of motor cortex of non-neurological disease control subjects and Huntington’s disease patients. At least 200 nuclei were counted per each group. B, C, E: Z projections (3 μM) are shown. D, F: Data are shown as mean ± SEM. *: P<0.05, **: P<0.01, ***: P<0.001, chi-square test.
See also Figure S4.

