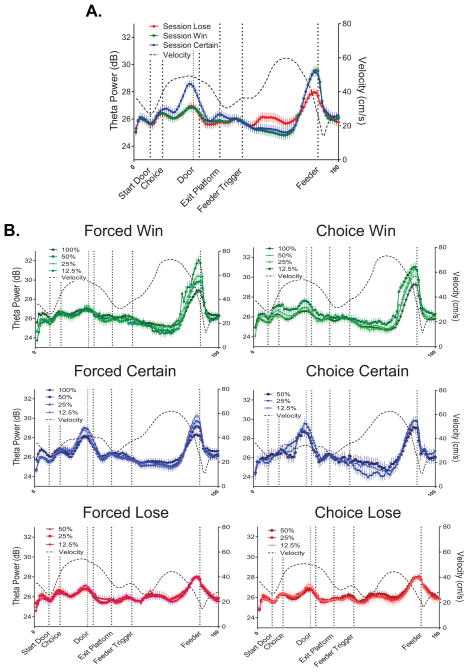
Figure 5. Power of the theta rhythm varied according to changing economic conditions of choice.
A. Mean (±SEM) theta power is compared across choice outcomes on a linearized representation of the loop maze. While some variability is observed, particularly striking is the peak in theta power that starts prior to reward (feeder) encounters. Most notable, the greatest theta response is observed around the feeder, particularly for win and certain trials. The mean velocity of the rat is shown by the black dashed line. It can be seen that the overall fluctuations in theta power did not track directly variations in velocity, suggesting that other factors contributed to the theta changes. B. The whole session data shown in A) are broken down according to agency (forced choice-left column; free choice-right column) and choice outcome (win, certain, lose) within each panel. Theta data are further broken down according to the expected probability of reward. Several patterns of results are clear. The increased theta power around the feeder is not only greatest for win trials, followed by certain trials (and very little for lose trials), but the magnitude of the increased theta power scales to the expected probability of reward. That is, the smallest increase in theta was observed during 100% win trials (after both forced and free choices), and the largest increase in theta power was observed during 12.5% win trials. A similar type of scaling was observed during the forced choice, certain trials.

