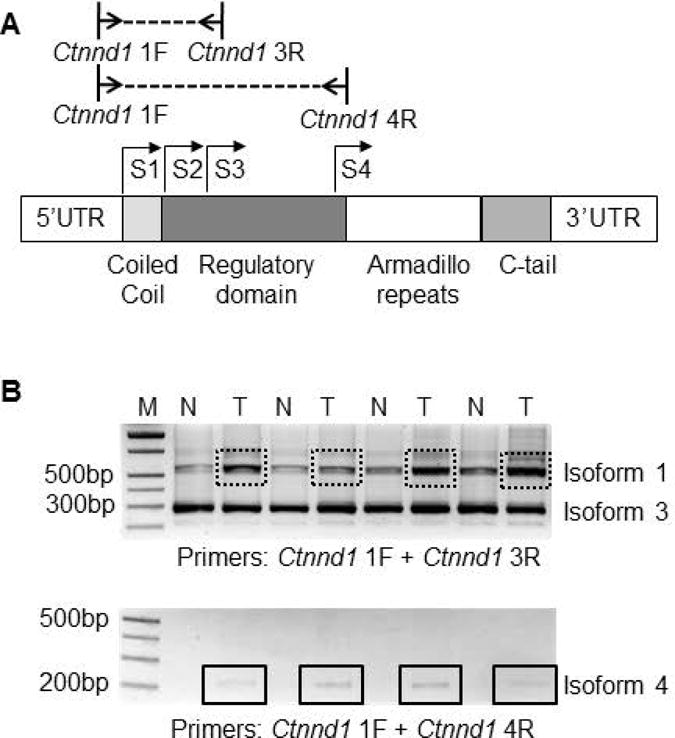
Figure 5.

(A) Schematic diagram of rat Ctnnd1 and primer locations used to examine different p120-catenin isoforms; S1–S4, alternative start codons. (B) Representative RT-PCR data for Ctnnd1 isoforms 1, 3 and 4; T, tumor; N, normal-looking tissue; M, molecular marker (DNA ladder). Boxes, increased expression of p120-catenin isoform 1 and isoform 4 in tumor vs. normal.
