
Figure 1.
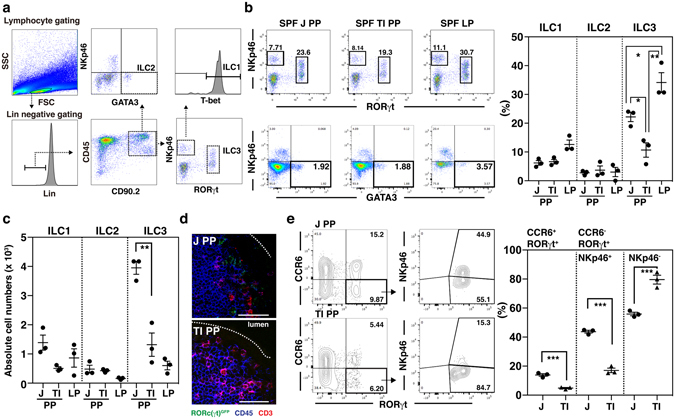
Terminal ileal PP has fewer ILC3s than jejunal PP. (a) ILCs were categorized into ILC1s, ILC2s, and ILC3s using a gating strategy such that lin−RORγt− NKp46+ T-bet+, lin− NKp46− GATA3+, and lin− RORγt+ NKp46+/− PP cells represented ILC1s, ILC2s, and ILC3s, respectively. (b) The distribution of ILCs in PPs of the terminal ileum (TI PP), jejunum (J PP), and lamina propria (LP) of SPF mice was analyzed by flow cytometry according to the gating strategy above. The numbers indicate the percentage of cells in each gated area and data are representative of three independent experiments. (c) The absolute numbers of ILC1s, ILC2s, and ILC3s were counted from PP cells of the terminal ileum (TI PP), jejunum (J PP), and lamina propria (LP) in SPF mice, as explained in the Methods. (d) The CD3− CD45+ (blue) RORγtgfp/+ (green) ILC3 cells were analyzed in cryosectioned slices of jejunal and terminal ileal PPs, prepared from RORc(γt)gfp reporter mice, by confocal laser scanning microscopy. The scale bar represents 50 μm and the dotted line depicts the FAE of PPs. (e) The frequencies of ILC3 subtypes (CCR6+, CCR6− NKp46+, and CCR6− NKp46−) were analyzed from jejunal and terminal ileal PP cells of SPF mice by flow cytometry. Data represent the mean ± SE calculated from three independent experiments with three mice per group. *p < 0.05, **p < 0.01, ***p < 0.001 indicate significant differences between the groups compared.